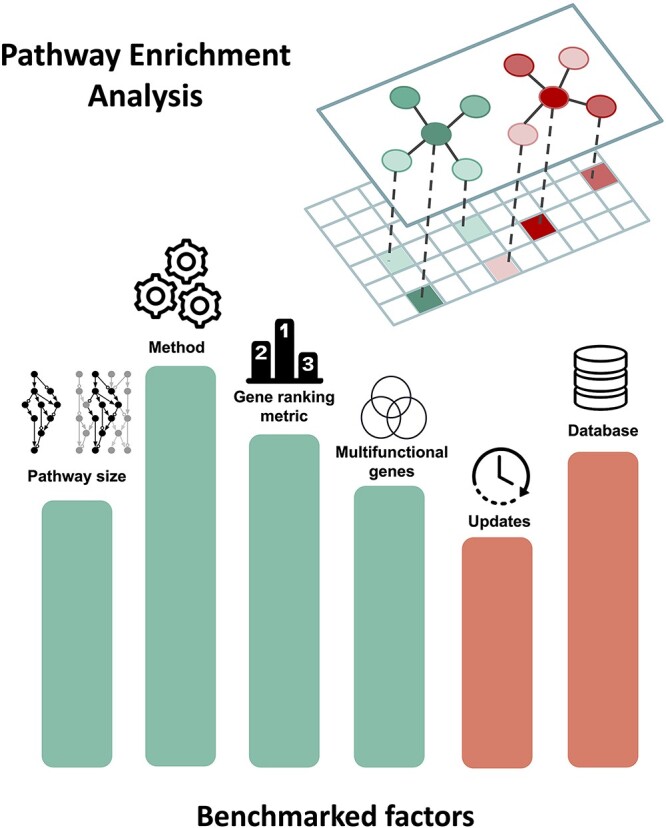
Figure 1.

Illustration of major factors that influence the results of pathway enrichment analysis discussed in this review. The height and color of the bars are symbolic and do not correlate with importance. The two networks depicted above represent two biological pathways mapped to gene expression data (matrix below).
