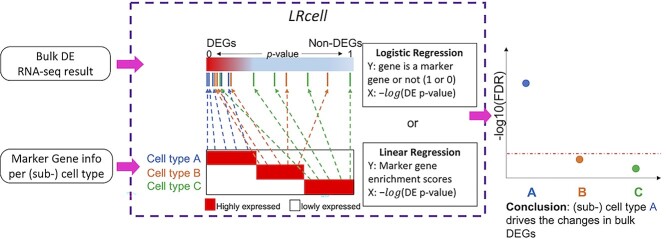
Figure 1.
Overview of LRcell workflow. As input, LRcell takes in the result from a case-control bulk RNA-seq experiment conducted on specific tissue. For illustration purpose, assuming there are three (sub-)cell types within the tissue, and the marker genes derived from (unrelated) scRNA-seq experiment on the three (sub-)cell types are available and taken into account by LRcell. Here, we use the blue color to indicate cell type A, the yellow color to indicate cell type B and the green color to indicate cell type C. We map the marker genes to the entire gene list sorted by DE P-values from the most significant DE to non-DE. Next, for each tissue type, we apply a regression analysis. When using the binary indicator of marker gene as the response variable, we run a logistic regression (LR); when using the enrichment score of the marker gene produced by the Marques et al.’s method as the response variable, we run a linear regression (LiR). In both cases, the explanatory variable is the − transformed DE P-value. Next, the significance of the regression analysis is calculated and converted to −
 transformed FDR and plotted. In this illustrating example, LRcell result indicates cell type A is the most significant, which suggests that cell type A is likely to play a significant role in the case-control experiment.

