Figure 2.
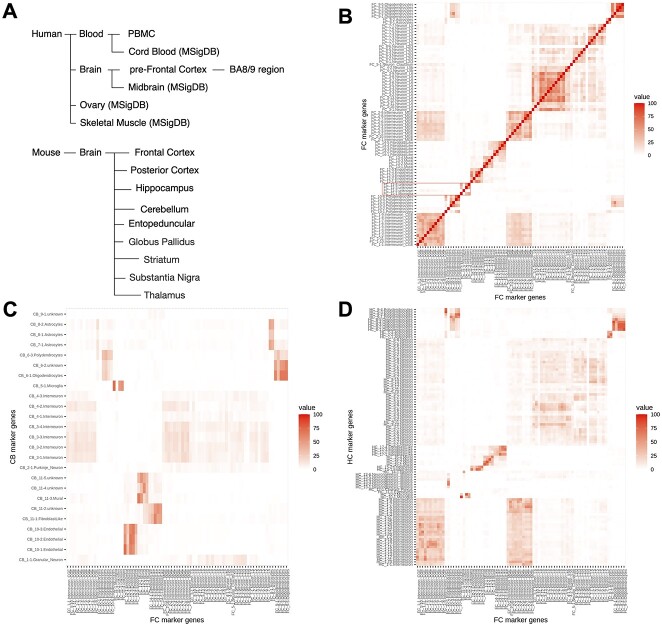
LRcell datasets and marker genes overlap between different brain regions. (A) summary of the all tissue-types in which marker genes have been pre-embedded in LRcell. In (B–D), top 100 marker genes are selected for each cell type, and thus, the maximum overlap in these figures is 100. (B) Heatmap illustrating the overlap of marker genes among cell types within the FC region derived from mouse whole brain scRNA-seq dataset. The highlighted area describes the overlap between FC_11-3.unknown, FC_11-4.unknwon and FC_11-1.Microglia as an illustration for the similarity between these three (sub-)cell types. (C) Heatmap illustrating the overlap of marker genes among cell types within the FC and cell types within the cerebellum CB. (D) Heatmap illustrating the overlap of marker genes among cell types within the FC and cell types within the hippocampus.

