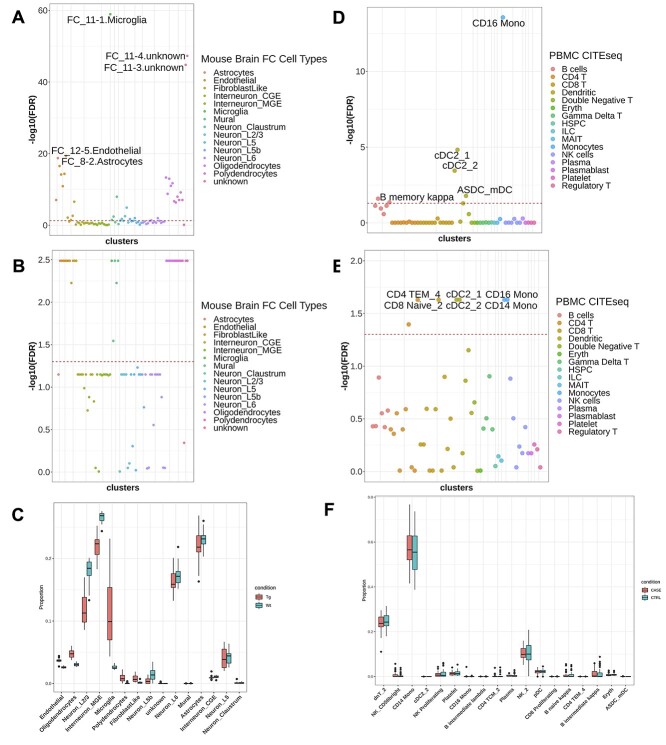
Figure 3.
Applying LRcell to real cases. (A) LRcell result of mapping the bulk neurodegenerative dementia DEGs to the mouse brain FC region. (B) GSEA result of mapping the bulk neurodegenerative dementia DEGs using the same marker genes used in LRcell (mouse brain FC) as input. (C) Cell-type proportions for control and disease samples calculated by MuSiC. Each box contains 17 individuals. The x-axis is ordered by the t-test significance between the two conditions. (D) LRcell result of mapping bulk PTSD DEGs to human PBMC. CD16+ monocytes is shown as the most significant cell type. (E) GSEA result of mapping bulk PTSD DEGs to human PBMC using the same marker genes used in LRcell (human PBMC) as input. (F) Cell-type proportions for control and disease samples calculated by MuSiC. The x-axis is ordered by the t-test significance between two conditions.

