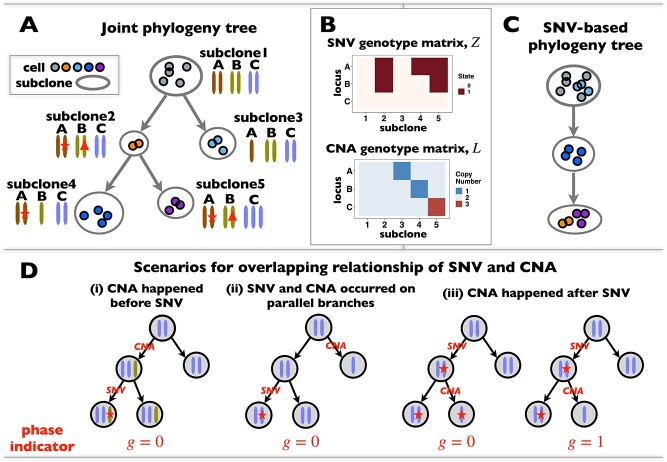
Figure 1.
ScDNA-seq data display tumor heterogeneity. (A) Joint tumor phylogeny tree by SNV and CNA, where the gray node represents normal cells and the other nodes are cancerous cells. The letters A, B, and C are mutation loci. The bars under each letter represent alleles, and the bars with red stars and triangles are mutated. (B) The SNV genotype matrix,  , and the CNA genotype matrix,
  , where rows represent loci and columns are subclones. (C) The phylogeny tree generally obtained by SNV-based algorithms. (D) Three possible scenarios for the overlapping relationship of SNV and CNA along the tree.

