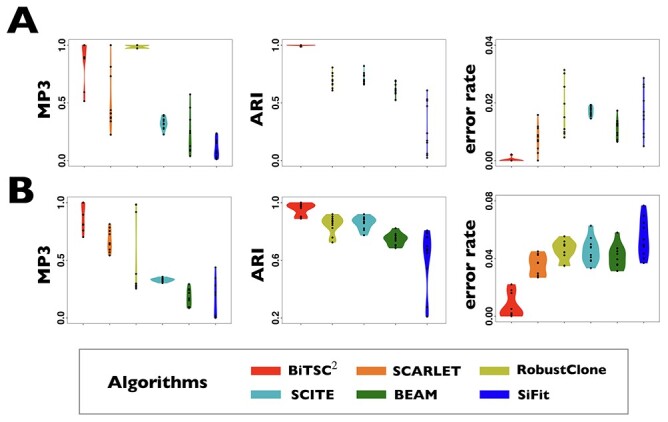
Figure 3.

Comparison of performance on G1 and G2 for scSNV genotype recovery, subclone assignment and tree reconstruction. (A) The violin plot of BiTSC with real segments as input, SCARLET with true CN tree and supported loss set as input, RobustClone, SCITE, BEAM and SiFit for error rate of recovered scSNV genotype matrix, ARI of subclone assignment and MP3 similarity on G1 dataset, where 0, 1 and 1 indicate best performance for error rate, ARI and MP3 similarity, respectively. (B) The violin plot of BiTSC
 with real segments as input, SCARLET with true CN tree and supported loss set as input, RobustClone, SCITE, BEAM and SiFit for error rate of recovered scSNV genotype matrix, ARI of subclone assignment and MP3 similarity on G2 dataset, where 0, 1 and 1 indicate best performance for error rate, ARI and MP3 distance, respectively.
