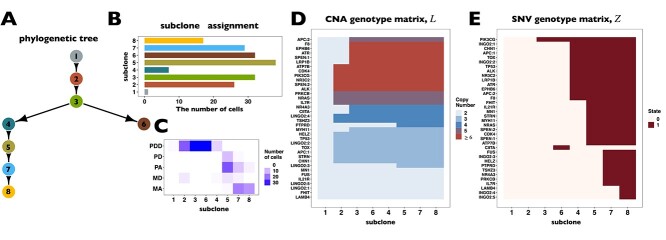
Figure 5.
BiTSC reconstructs tumor phylogeny of metastatic colorectal cancer. (A) The phylogeny tree of metastatic colorectal cancer reconstructed by BiTSC
 . (B) The subclone assignment. (C) The number of overlapped cells contained in subclones identified by BiTSC
 and cells contained in the targeted region, where PD stands for Primary Diploid, PA stands for Primary Aneuploid, MD stands for Metastatic Diploid, and MA stands for Metastatic Aneuploid in [33]. (D) The CNA subclonal genotype matrix estimated by BiTSC
 , where LINGO2: 1–5 represent different loci in the genomic region of LINGO2 on the chromosome, as well as SPEN:1-2 and APC:1-2. (E) The SNV subclonal genotype matrix estimated by BiTSC
 .
.

