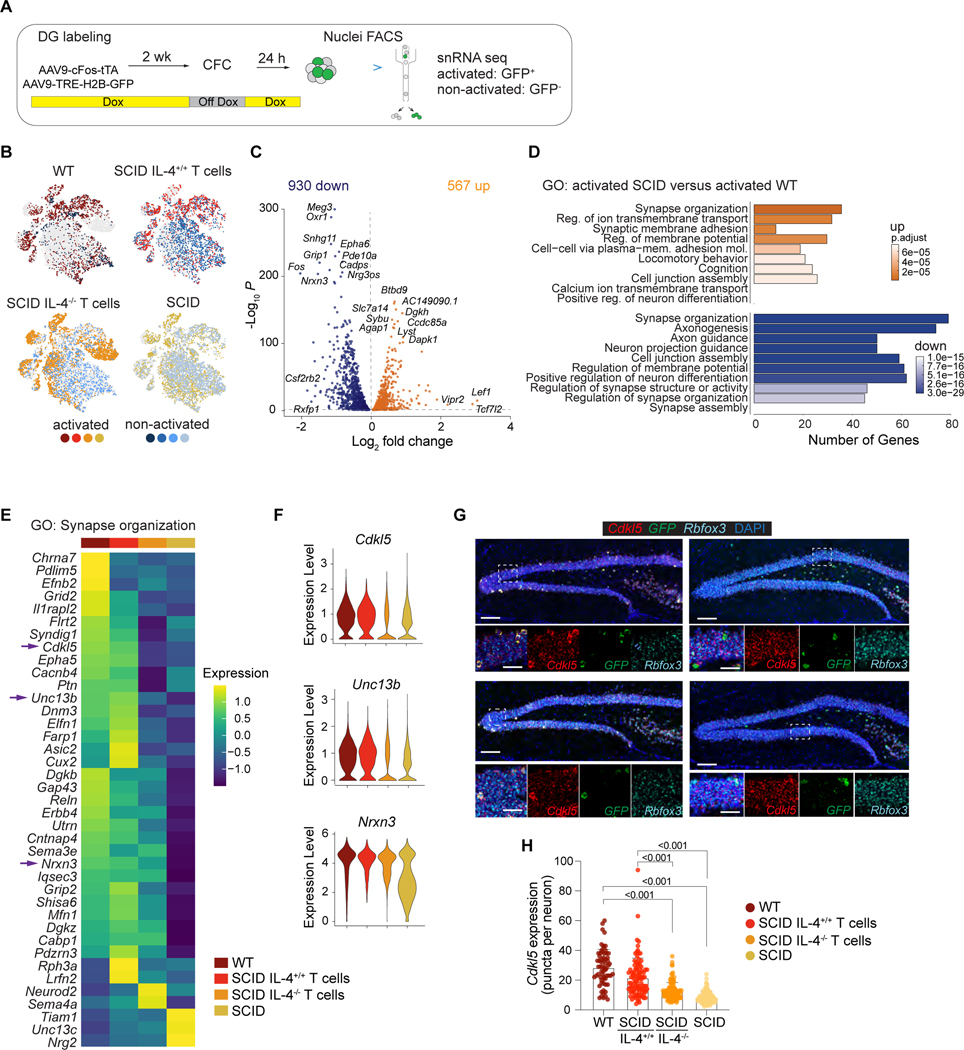
Figure 2. T cell-derived IL-4 orchestrates transcriptomic changes in synapse-related genes.
A, Schematic representation of the experimental design. WT and SCID mice were injected with AAV9c-Fos-tTA and AAV9-TRE-H2B-GFP and maintained on doxycycline (DOX) chow. The dentate gyrus (DG) was labeled two weeks prior to training. To specifically label training activated neurons, mice were taken off DOX food 24 hour before training and feed DOX chow immediately after training. Activated (GFP+) and non-activated (GFP-) neuronal nuclei from the DG were sorted by flow cytometry and subjected to single-nuclei RNA sequencing. B, t-SNE showing the distribution of nuclei from each sample (WT, SCID, SCID with IL-4+/+ T cells, SCID with IL-4−/− T cells) of activated and non-activated neurons across clusters. C, Volcano plot showing differentially expressed genes in activated WT compared to activated SCID neurons. Top differentially expressed genes are annotated with text. D, Gene ontology analysis (GO) of top 10 pathways by significance comparing differentially expressed genes in activated GFP+ neuronal nuclei from SCID and WT mice. E, Heat map showing the average scaled expression of significant differentially expressed genes in GO: Synapse organization (0050808) between activated WT, SCID with IL-4+/+ T cells, SCID with IL-4−/− T cells and SCID of neuronal nuclei. Mean of n = 3 – 4 biological samples. F, Violin plots showing the distribution of expression of Cdlk5, Unc13b and Nrxn3 in activated neuronal nuclei. G, Representative images of multi-color RNAscope experiments showing Cdkl5 gene expression of activated (GFP+) neurons (Rbfox3+) in the dentate gyrus for conditions shown in E and F. Scale bars = 200 μm or 40 μm. H, Quantifications of Cdkl5 gene expression in activated neurons (GFP+ Rbfoxp+) of WT (n=64 neurons), SCID with IL4+/+ T cells (n= 95 neurons), SCID with IL-4−/− T cells (n=116 neurons) and SCID mice (n=116 neurons) from 3–4 mice per group. Data are presented as mean ± SEM. Two-way ANOVA with Bonferroni post hoc test. See also Figure S3 and S4.

