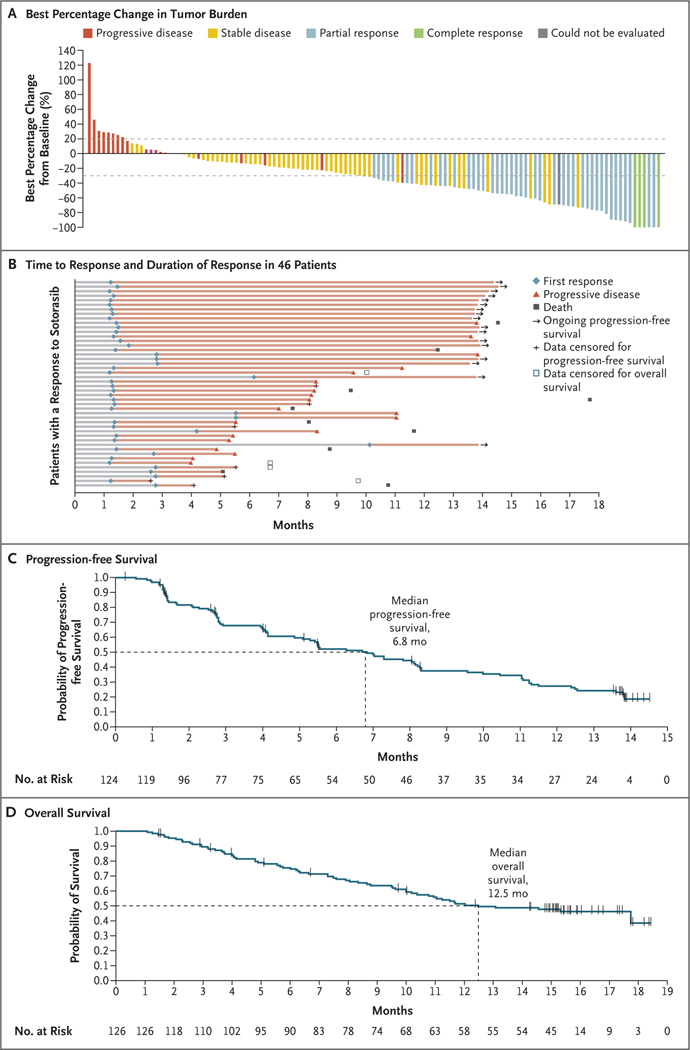
Figure 1. Efficacy of Sotorasib Therapy.
Panel A shows the best percentage decrease from baseline in the tumor burden (defined as the sum of the longest diameters of all target lesions) in 121 of 124 patients with non–small-cell lung cancer who had available post-baseline measurements of target lesions. The 3 patients whose data were excluded from the graph include 2 who had missing scans and 1 who had no measurement in target lesions and had progressive disease in nontarget lesions (progressive disease as the best overall response). Panel B shows the time to response, duration of response, and patient status as of the data-cutoff date for all 46 patients who had an objective response to sotorasib therapy. Panel C shows the Kaplan–Meier curve of progression-free survival among all 124 patients who could be evaluated for a response according to central review. Panel D shows the Kaplan–Meier curve of overall survival among all 126 patients enrolled in the trial. Tick marks in Panels C and D indicate censored data.

