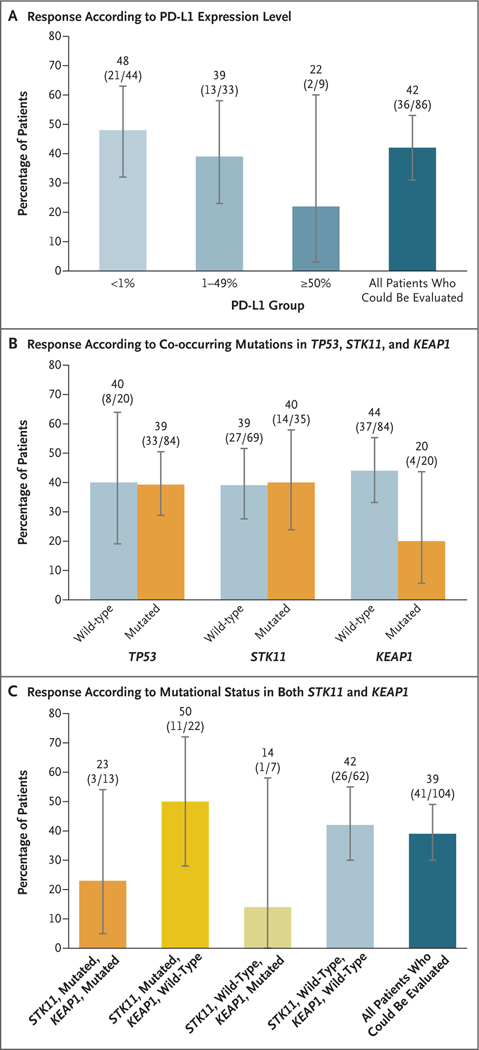
Figure 2. Exploratory Biomarker Analyses.
Panel A shows the percentages of patients with an objective response associated with sotorasib therapy in subgroups categorized according to programmed death ligand 1 (PD-L1) expression level. A total of 86 patients with available tissue data were evaluated. Panel B shows the percentages of patients with an objective response in subgroups categorized according to the mutational status of TP53, STK11, and KEAP1, and Panel C the percentages of patients with an objective response in subgroups categorized according to the mutational status of STK11 and KEAP1. In these analyses, 104 patients with available tissue data, plasma data, or both were evaluated. In all panels, I bars represent 95% confidence intervals.

