. 2022 Apr 1;13(19):5539–5545. doi: 10.1039/d1sc06659e

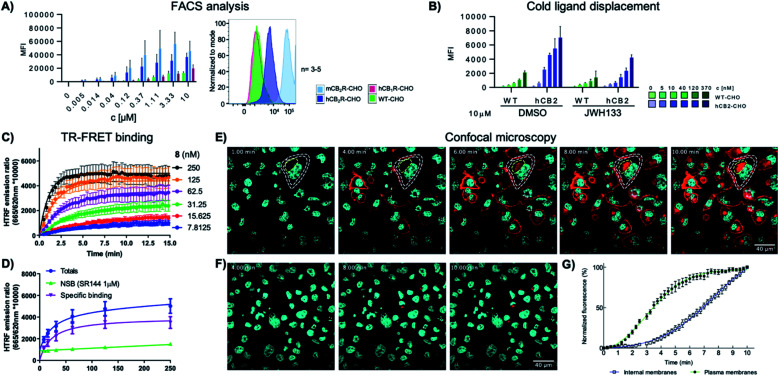
Fig. 2. (A) FACS analysis of the mean fluorescent intensity (MFI) of WT, hCB2R, mCB2R and hCB1R overexpressing CHO cells at different concentrations of 8-SiR. (B) FACS analysis of the MFI of WT and hCB2R-CHO cells pre-treated with JWH133 (10 μM) and stained with different concentrations of 8-SiR; see ESI for details. (C and D) TR-FRET characterization of 8-SiR binding association (C) and saturation analysis (D) using HEK-hCB2R cell membranes. (E and F) Time-lapse confocal microscopy frames for hCB2R (E) and hCB1R (F). CHO cells co-stained with 8-SiR (red) and Hoechst 33342 (cyan, nucleus counter stain) at 1, 4, 6, 8 and 10 min; plasma and internal membranes are highlighted with white and yellow dashes, respectively. (G) Association curve of 0.4 μM 8-SiR on plasma membrane and internal membranes of hCB2R-CHO cells. See also ESI Videos S1 and S2..

Fig. 2