Figure 6.

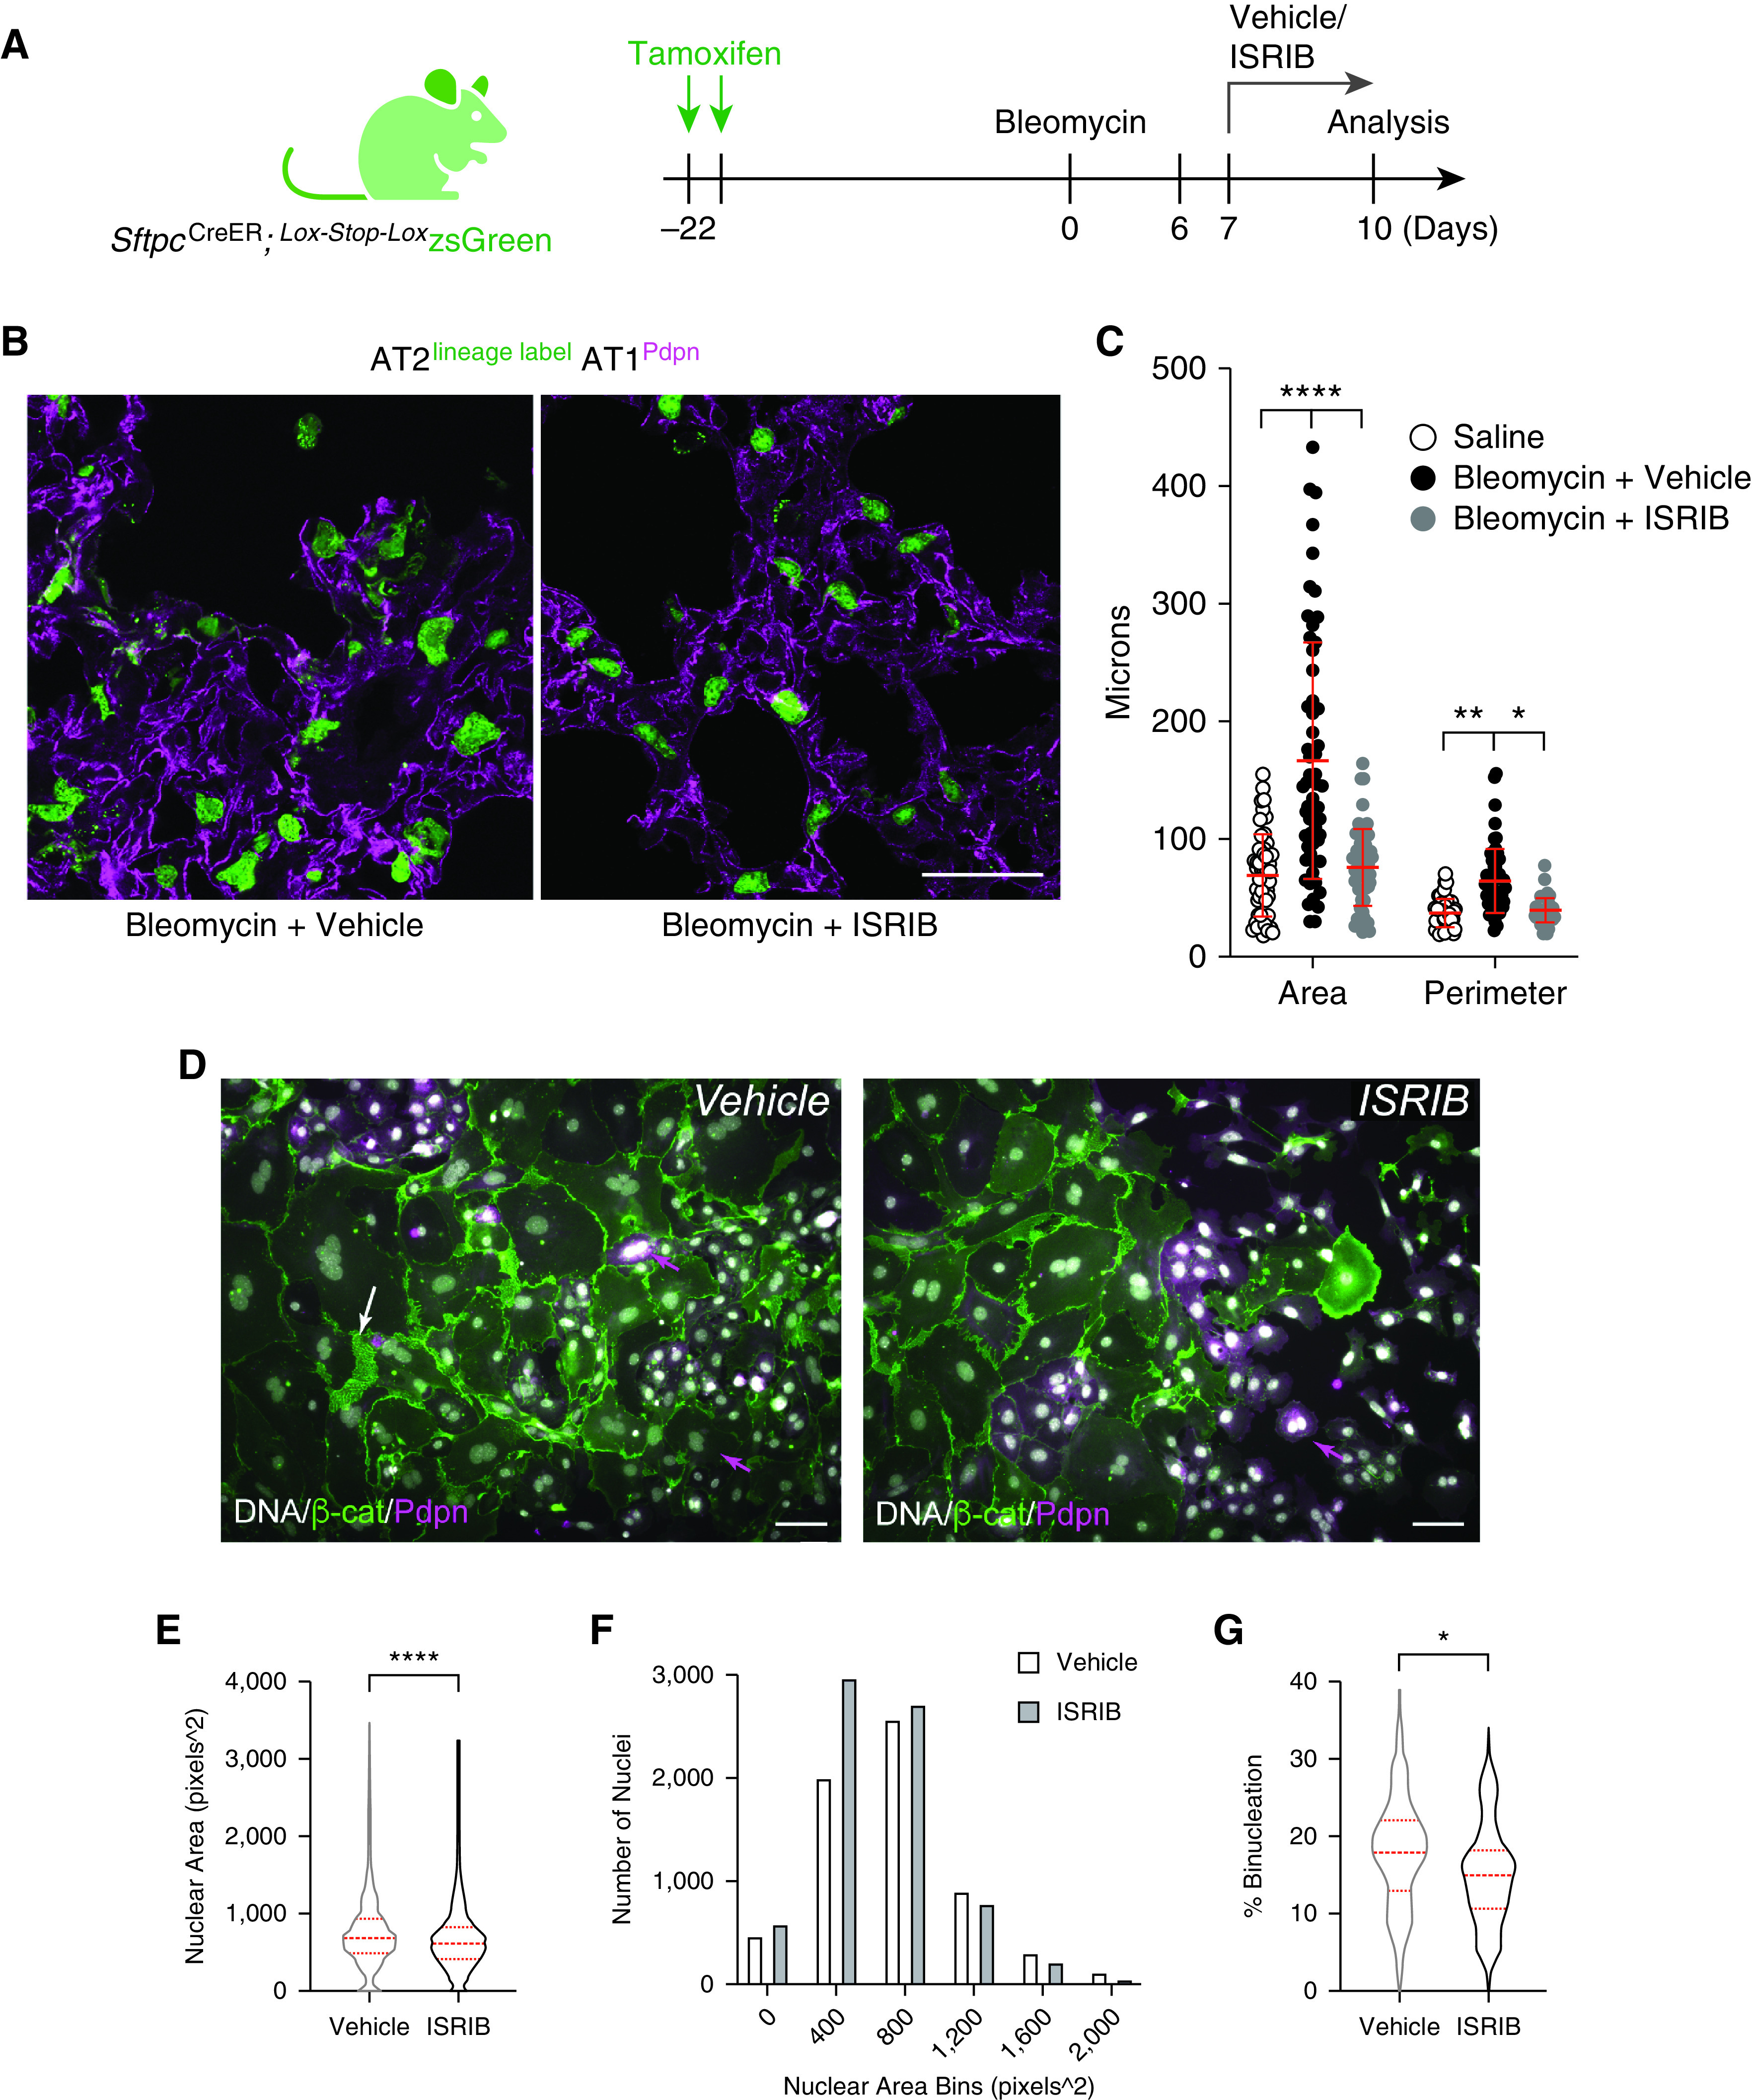
The inhibitor of the integrated stress response (ISRIB) limits AT2 hypertrophy and polyploidy cell autonomously. (A) AT2 lineage trace before bleomycin injury with and without ISRIB therapy. (B) Confocal images of fixed frozen lung sections with native zsGreen and immunofluorescence of AT1 marker Pdpn. Scale bar, 50 μm. (C) Scatterplot of zsGreen object sizes by Fiji as described in Figure E1. Graph is identical to Figure 1C with ISRIB data added. Significance was determined by ANOVA. ****P <0.0001, **P = 0.0070, and *P = 0.0122. (D) Epifluorescence overlay images of mouse AT2 cell Day 2 cultures incubated with vehicle/ISRIB (0.025 μm) through Days 4 and 5. Arrows (magenta) show Pdpn+ binucleated cells that are peripheral to large, flat, bi-/trinucleated cells with diminishing Pdpn and high levels of β-catenin (white arrow). Scale bars, 50 μm. (E) Nuclear area (DNA) measurements by ImageJ as a proxy for cell size allowed unbiased analysis. n = 6,829 (vehicle) and 7,387 (ISRIB) nuclei measured. Data were averaged from three independent AT2 isolations for cells quantified at 48 and 72 hours with or without ISRIB. ****P < 0.0001 by Mann-Whitney test. (F) Histogram of data in E. (G) Binucleation events quantified as from 44 (vehicle) and 43 (ISRIB) fields of view. *P = 0.035 by Mann-Whitney test. Dashed red lines reflect median and first and third quartiles.
