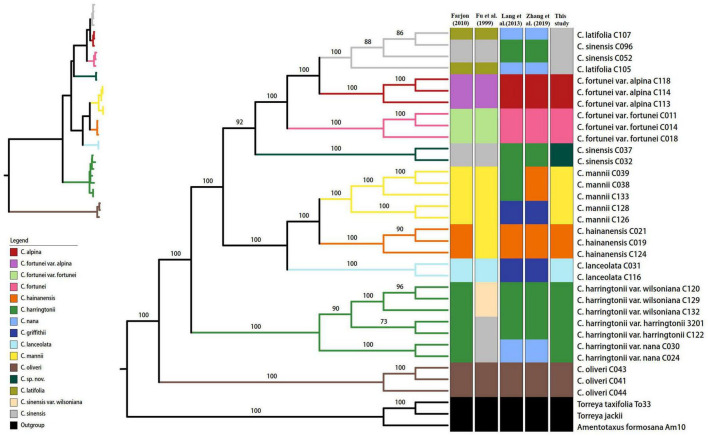
FIGURE 2.
Phylogenetic tree reconstructed via maximum-likelihood (ML) analysis of the complete plastome data. Numbers above branches indicate the bootstrap support values. In the top left is an ML phylogenetic tree with branch length excluding outgroups. The branch colors correspond with the species recognized in this study.

