Figure 1.

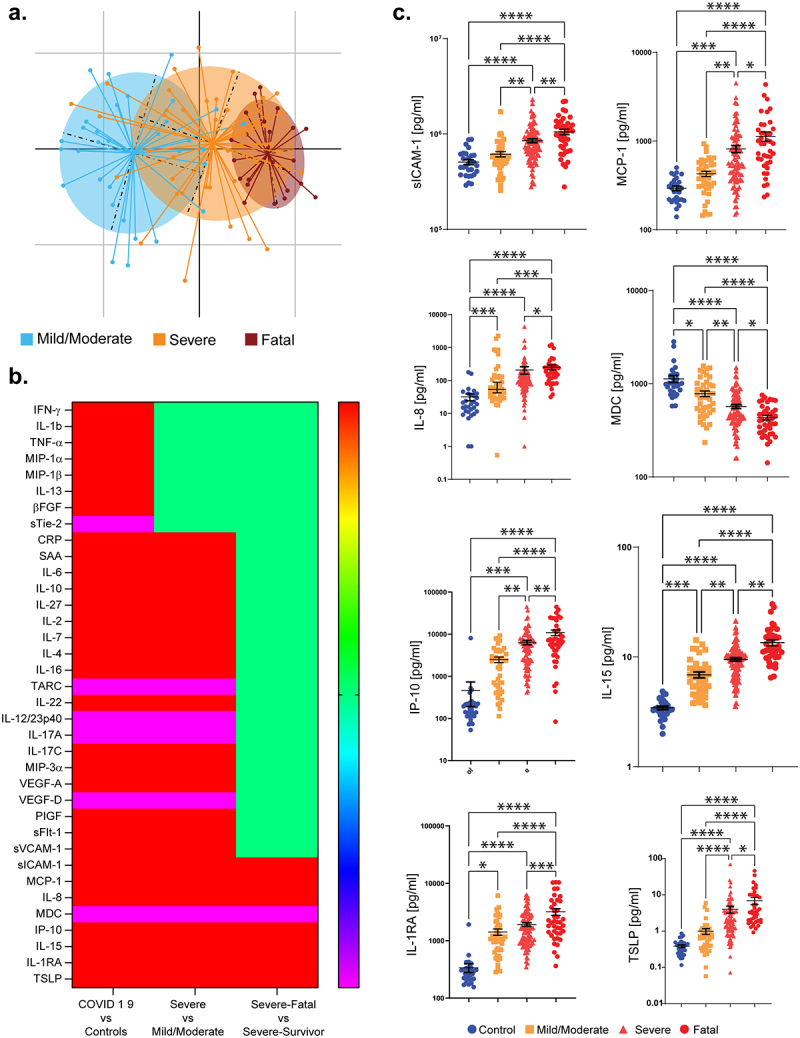
Circulating immune mediators in COVID-19 patients. (a) PCA plot illustrating the differences in serum cytokine and inflammatory mediator levels in COVID-19 patients with different levels of severity. (b) Heatmap illustrates the serum immune mediators that are significantly increased (red), significantly decreased (blue), or remain unchanged (green). (c) Levels of the cytokines that are significantly different in patients with severe COVID-19 that survive (labeled “Severe”), compared to those with severe COVID-19 that have a fatal outcome (labeled “Fatal”). Results are expressed as mean and standard deviation. Differences between groups are calculated using the Kruskal–Wallis test and Dunn’s multiple comparison test (*p < .05, **p < .01, ***p < .001, ****p < .0001).
