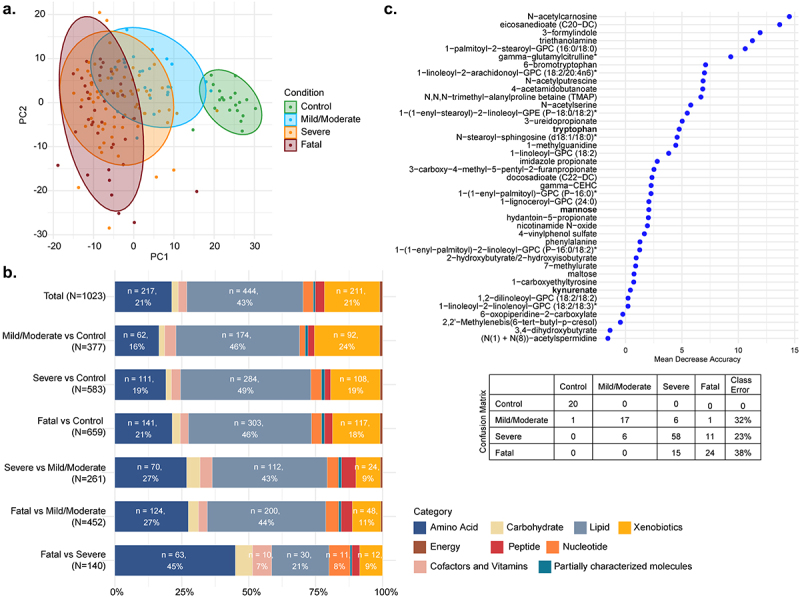
Figure 2.

Serum metabolites in COVID-19 patients. (a) PCA plot for the four conditions: control, mild/moderate, severe, fatal; (b) Barplot representing super pathways of the significant metabolites (LIMMA, FDR <0.05) between each comparison of conditions; (c) importance plot and confusion matrix from the random forest classifier between the four conditions.
