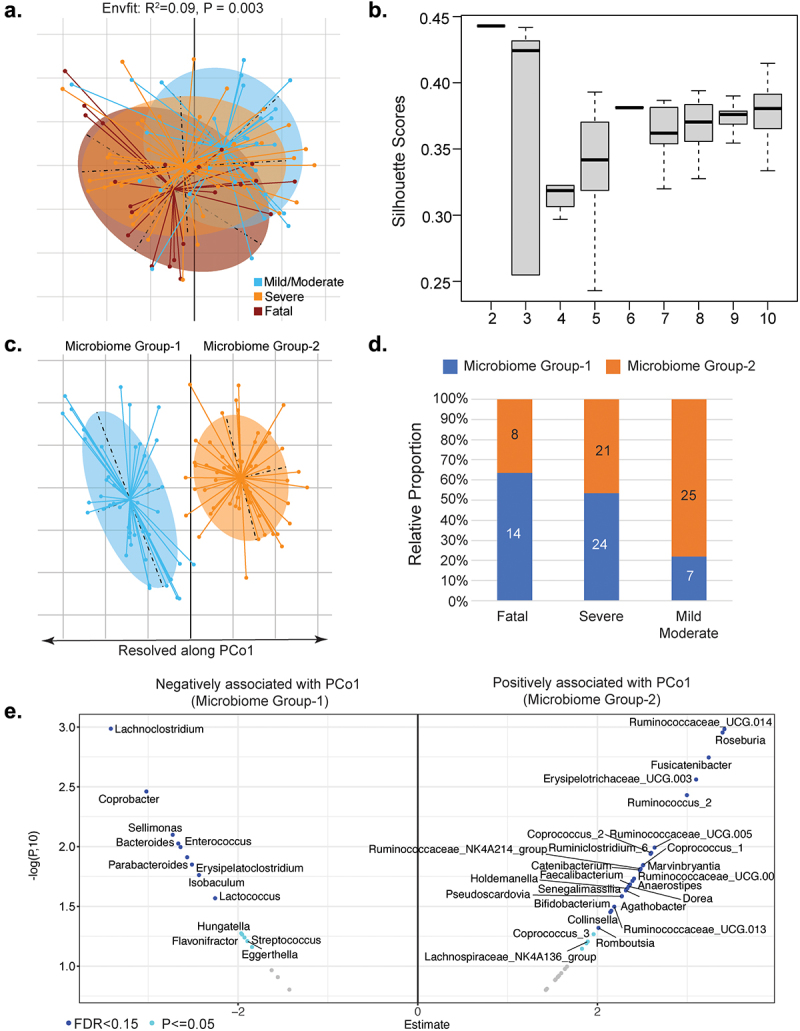
Figure 4.

Gut microbiome composition in COVID-19 patients. (a) Principal coordinate analysis of the genus-level microbiome composition of the three outcome groups of patients obtained using the Canberra distance measure. (b) Variation of the silhouette-Scores obtained, across for cluster sizes (k), for 50 iterations of k-means clustering of the first three dominant principal coordinates of the genus-level microbiome profiles. The principal coordinates of these two microbiome groups are demarcated in (c). The two microbiome groups exhibited distinct patterns of association with three COVID-19 disease severity outcome groups (d). (e) Volcano plot illustrates genera showing either significant (FDR ≤0.15, shown in blue) or nominally significant (P ≤ .05, shown in cyan) associations with PCo1. The x-axis shows the estimate of the linear-regression models (direction indicating the pattern of association) and y-axis shows the -logarithm of the p-value to the base 10. The genera associating with the high-risk MicrobiomeGroup1 are on the negative axis and those associating with low-risk MicrobiomeGroup2 are on the positive axis. Only those genera showing associations with P ≤ .05 are shown.
