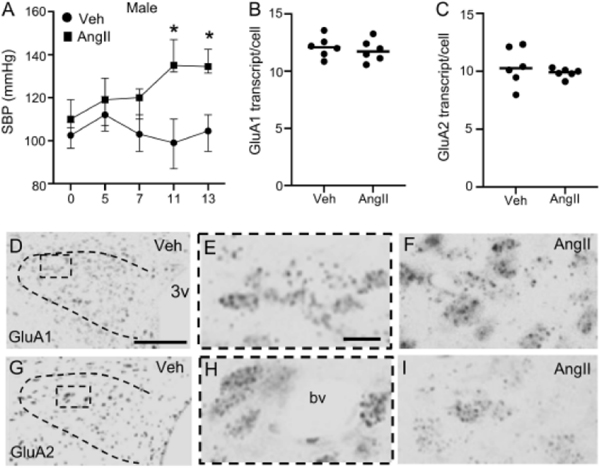
Fig. 1. Blood pressure and AMPA receptor subunit mRNA levels in the PVN of male mice following AngII infusion.
Systolic blood pressure (SBP) was elevated in male mice infused with AngII versus vehicle (Veh; A). There were no differences in GluA1 (B) or GluA2 (C) transcript in Veh and AngII-infused male mice. Light micrographs from PVN (bounded area) showing GluA1 at low (D) and high (E, area from the bounded box in D) magnifications in a Veh-infused mouse. GluA1 mRNA from an AngII-infused mouse is shown at high magnification in F. Light micrographs showing GluA2 mRNA in the PVN of a male Veh-infused mouse are shown at low (G) and high (H, area in the bounded box from G) magnifications. A micrograph illustrating GluA2 mRNA from a male AngII-infused mouse is shown in (I). 3v: Third ventricle; bv: blood vessel. A: * p< 0.05 SBP AngII versus Veh Days 11 and 13. Points on the line graph in A are presented as medians ± 25th and 75th quartiles as error bars. Lines in B and C are group medians overlain with data points representing means for each animal. Scale bars: 400 μm (D, G), 25 μm (E, F, H, I).

