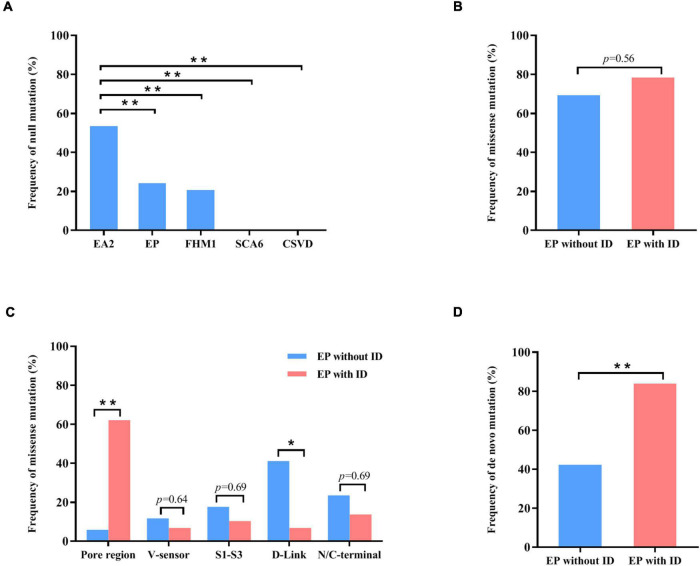
FIGURE 4.
Genotype–phenotype correlations of CACNA1A mutations. (A) The frequency of null mutations in CACNA1A for each phenotype. The values are expressed as the percentage of cases with null mutations (cases with null mutations/total cases) in each group. (B) The frequency of null mutations in CACNA1A for epilepsy without intellectual disability and epilepsy with intellectual disability. (C) The frequency of missense mutants in various regions of the Cav2.1 channel for epilepsy and epilepsy with intellectual disability. (D) The frequency of de novo mutations in CACNA1A for epilepsy and epilepsy with intellectual disability. Fisher’s exact test was used for statistical analysis of the differences between each group. CSVD, cerebral small vessel disease (n = 18). EA2, episodic ataxia 2 (n = 155). EP, epilepsy (n = 63). EP without ID, epilepsy without intellectual disability (n = 26). EP with ID, epilepsy with intellectual disability (n = 37). FHM1, familial hemiplegic migraine 1 (n = 53). SCA6, spinocerebellar ataxia 6 (n = 7). * P < 0.05; ** P < 0.01.

