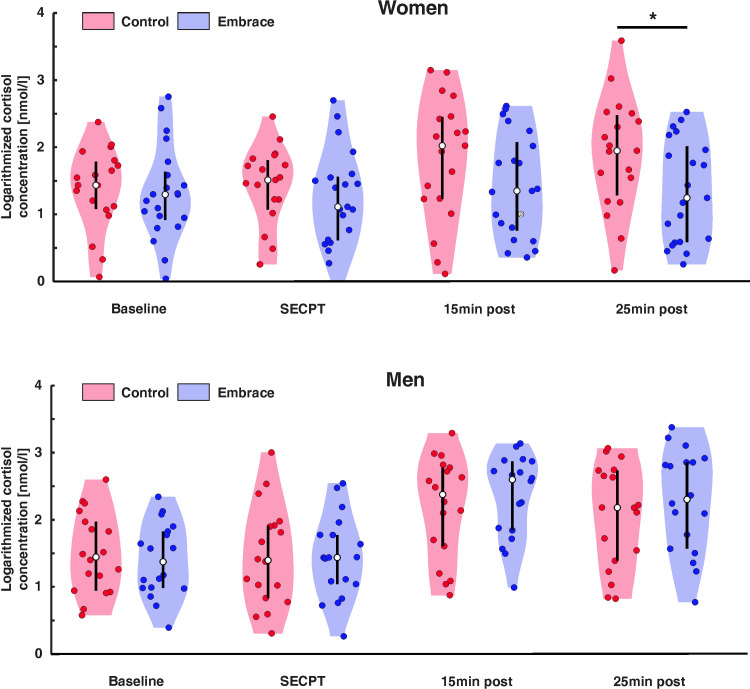
Fig 2.
Cortisol concentration for women (top) and men (bottom) during baseline, the SECPT and 15 minutes as well as 25 minutes post SECPT for the embrace and control condition. White dots represent the median value for each group. Error bars represent the upper and lower quartiles. Group differences between the conditions are marked. * = p < .05.

