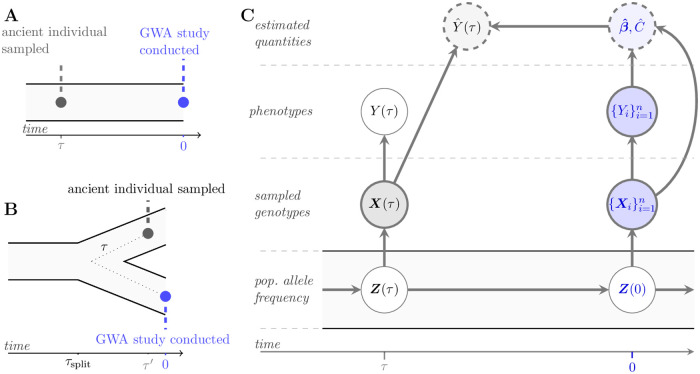
Fig 1. A population genetic model for an ancient polygenic score.
Figures (A) and (B) portray the two demographic scenarios encompassed by our modeling framework. In (A), the ancient individual is sampled at an earlier time τ from the same population in which the GWA study is conducted. In (B), the ancient individual is sampled at an arbitrary time τ′ from a population that split from the population in which the GWA study was conducted at some time τsplit in the past. The dotted line schematically relates τ′ to the ancient sampling time τ of (A), i.e., τ = 2τsplit − τ′. In (C), a graphical model relates the random variables explicit and implicit in the polygenic score and phenotype Y(τ) of an ancient individual sampled τ generations in the past, as in (A). Darkly shaded and thickly bordered nodes are observed quantities. Unshaded and thinly bordered nodes are unobserved. Lightly shaded nodes bordered by dashed lines denote estimated quantities. Edges denote direct dependencies between connected nodes. For example, conditional on the ancient genotype X(τ), the polygenic score is independent of the population allele frequencies Z(τ). Quantities in blue are associated with the present day only, and include the population allele frequencies Z(0); the genotypes of the n individuals in the GWA study, and their phenotypes, ; and, the effects and intercept term estimated in the GWA study, and , respectively.

