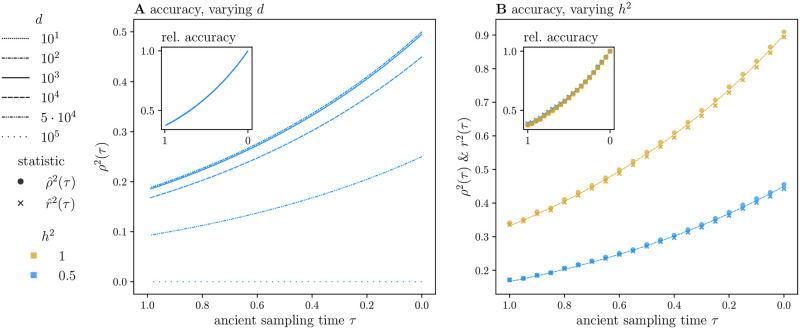
Fig 3. Polygenic score accuracy.
We plot our theoretical results for both absolute (A, main) and relative accuracy ρ2(τ) (A, inset) for ancient sampling times τ ∈ [1, 0] (or a time span of 2N generations) with a mutation rate of a = 10−3. The GWA study size is shared in all plots, with n = 105. In (A), we vary the detection threshold over the range of possible values, dℓ ∈ {10, …105}. In (B), we compare our theoretical expectations with simulated estimates of the approximate sample correlation coefficient ρ2(τ) (circles) and the statistic itself r2(τ) (crosses) for a threshold of d = 104 (a minimum sample allele frequency of 0.05), and two values of heritability, h2 = 0.5, 1 (in blue and gold, respectively). The ancient sample size is na = 100. In the inset of (B), we normalize the estimates by their initial (estimated) values. Theoretical expressions for ρ2(τ) are also plotted in (B). Each simulated point is the average of K = 5000 simulations of L = 5000 iid loci.

