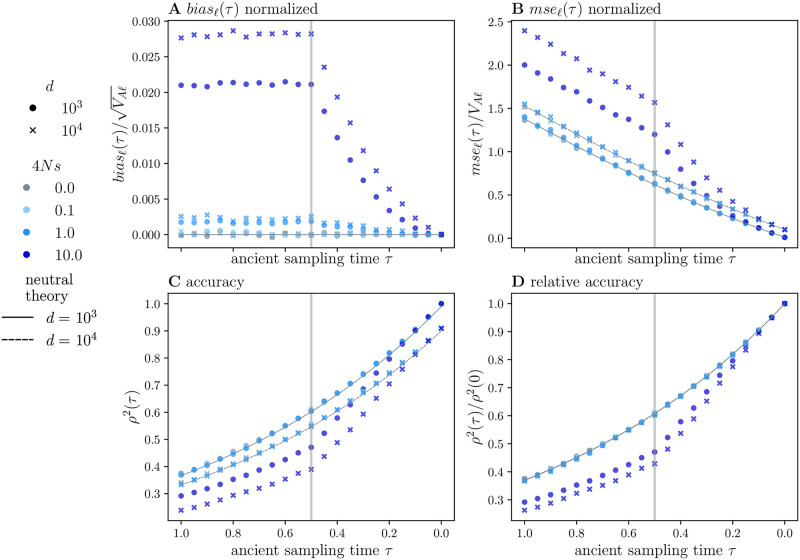
Fig 4. Ancient polygenic scores in the presence of genic selection.
We conduct K = 5000 simulations, each with a mutational target of L = 5000 loci, in a population of size 2N = 2 ⋅ 103, with a population-scaled mutation rate, a = 10−3. We consider four selection coefficients, σ = 4Ns ∈ {0, 0.1, 1, 10} (indicated by color). The GWA study sample size is 2n = 2 ⋅ 105, with d equal to either 103 or 104. In (A-D), we plot the various simulated statistics along with their neutral expectations (solid or dashed black lines). The vertical gray lines indicate the onset of selection at τs = 0.5 which corresponds to N = 1000 generations. The ancient sample times are τ ∈ [1, 0], corresponding to a time span of 2N = 2000 generations. We computed, but did not plot, 95% confidence intervals for bias(τ), mse(τ), and r2(τ), as they largely overlapped with the symbols. We note that the oscillations observed in (A) and (B) are not statistically significant.

