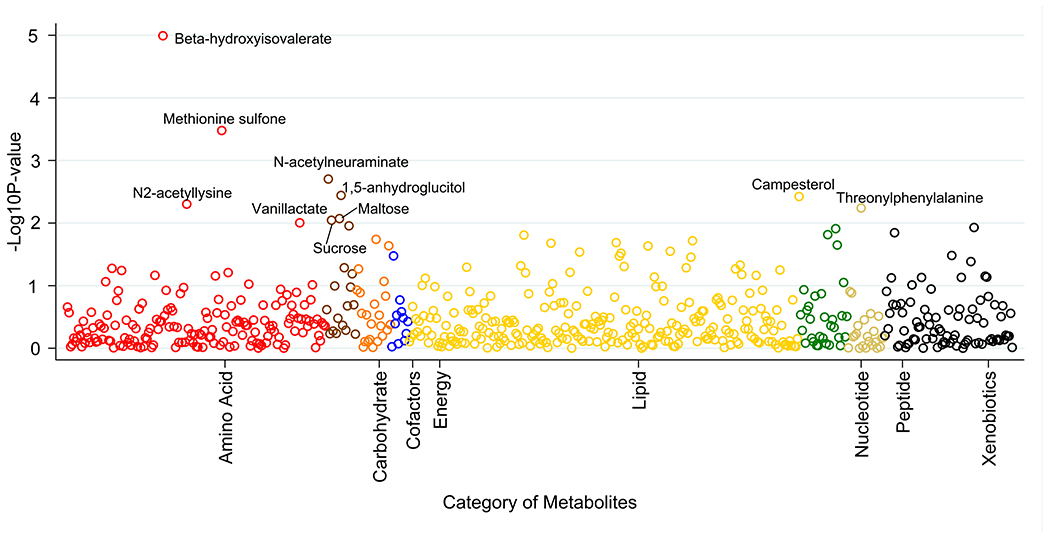
Figure 1. Plot of −log10Ps for the metabolomic profiles in response to the sodium reduction.

Ps were calculated based on the mixed effects models adjusted for age, sex and BMI as confounding variables. Associations with raw ps<0.01 are labeled with chemical names.
