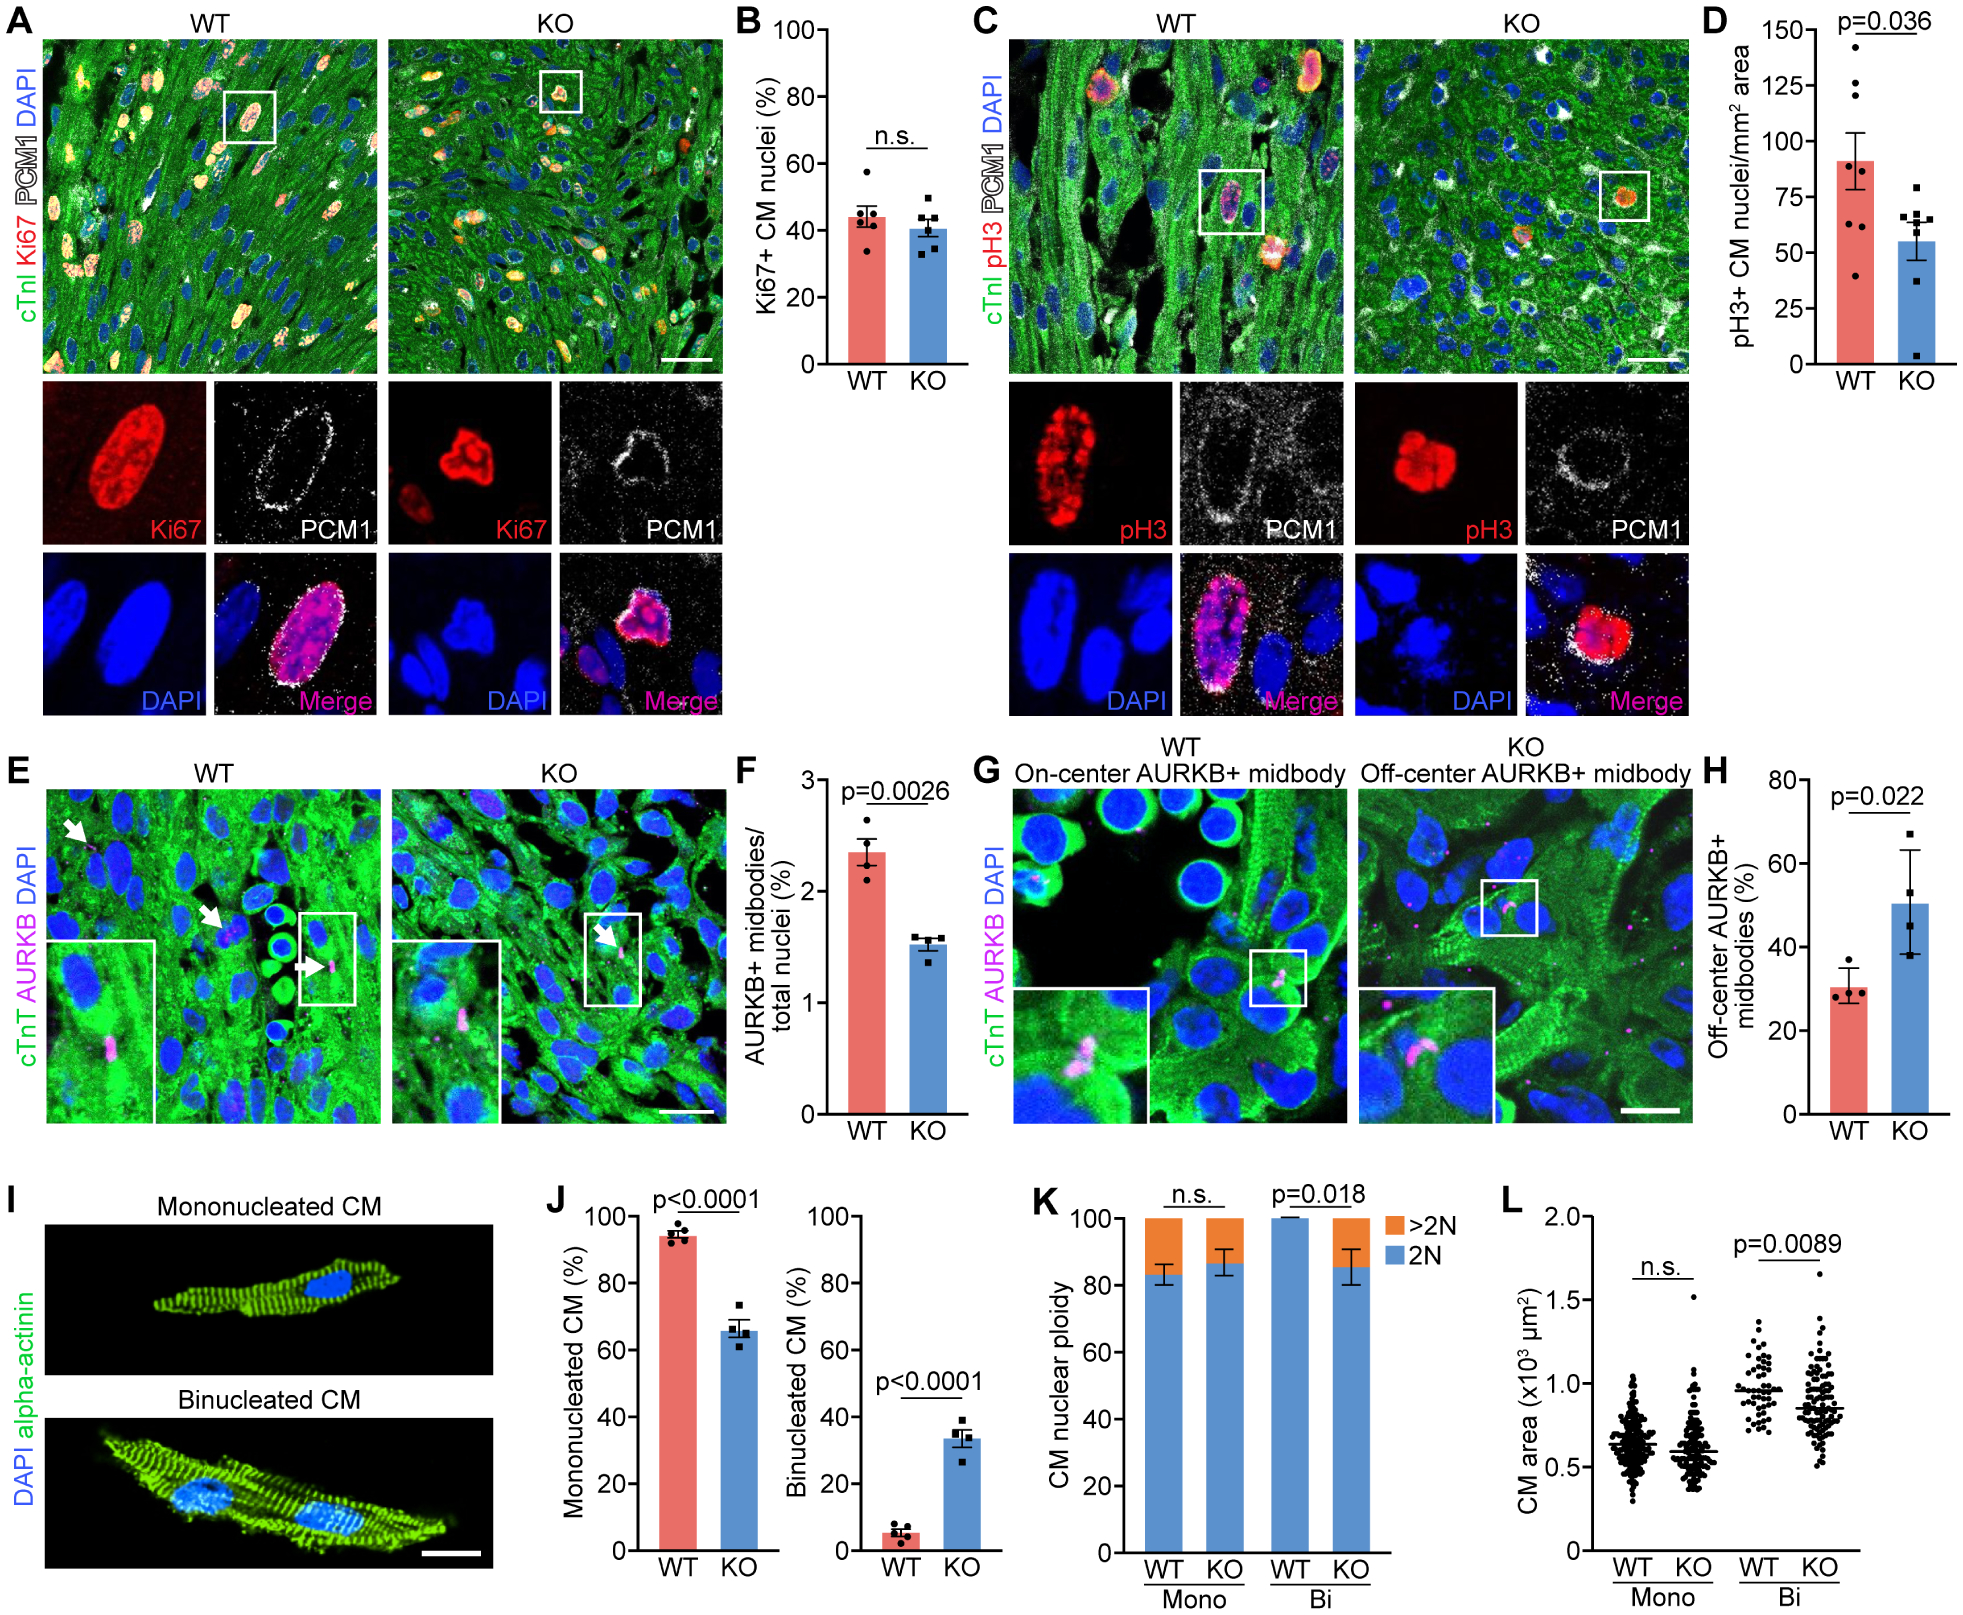
Figure 2. Cytokinesis defects of P1 Rbpms KO mouse cardiomyocytes.

A, B. Immunofluorescence staining for Ki67, cardiac troponin I (cTnI), PCM1 and DAPI on coronal sections of WT and KO myocardium at P1 and quantification of percentage of Ki67+ cardiomyocyte (CM) nuclei over total nuclei (n = 6 for WT and KO). Scale bar: 30 μm. C, D. Immunofluorescence staining for phosphorylated histone H3 (pH3), cTnI, PCM1 and DAPI of WT and KO myocardium at P1, and quantification of number of pH3+ CM nuclei per mm2 area. (n = 8 for WT and KO). Scale bar: 30 μm. E, F. Immunofluorescence staining for aurora B kinase (AURKB), cTnT and DAPI of WT and KO hearts at P1 and quantification of AURKB-positive midbody frequency (n = 4 for WT and KO). Scale bar: 25 μm. White arrows indicate AURKB-positive midbodies between nuclei. G. Representative immunofluorescence staining images of on-center and off-center AURKB-positive midbodies in P1 WT and KO heart sections. Scale bar: 10 μm. H. Percentage of off-center AURKB-positive midbodies in WT and KO hearts at P1 (n = 4 for WT and KO). I. Representative immunofluorescence images of P1 mononucleated and binucleated CMs stained for alpha-actinin. Scale bar: 20 μm. J. Percentage of mononucleated and binucleated CMs of P1 WT and KO hearts (n = 5 for WT, and 4 for KO). K. Quantification of the nuclear ploidy of the mononucleated (mono) and binucleated (Bi) CMs in P1 WT and KO hearts (n = 5 for WT mice, and 4 for KO mice, average 100–200 cardiomyocytes per mouse). n.s., not significant. L. Areas of individual mononucleated and binucleated CMs (n = 5 for WT mice, and 4 for KO mice, average 100–200 cardiomyocytes per mouse). n.s., not significant. All data are presented as mean ± SEM.
