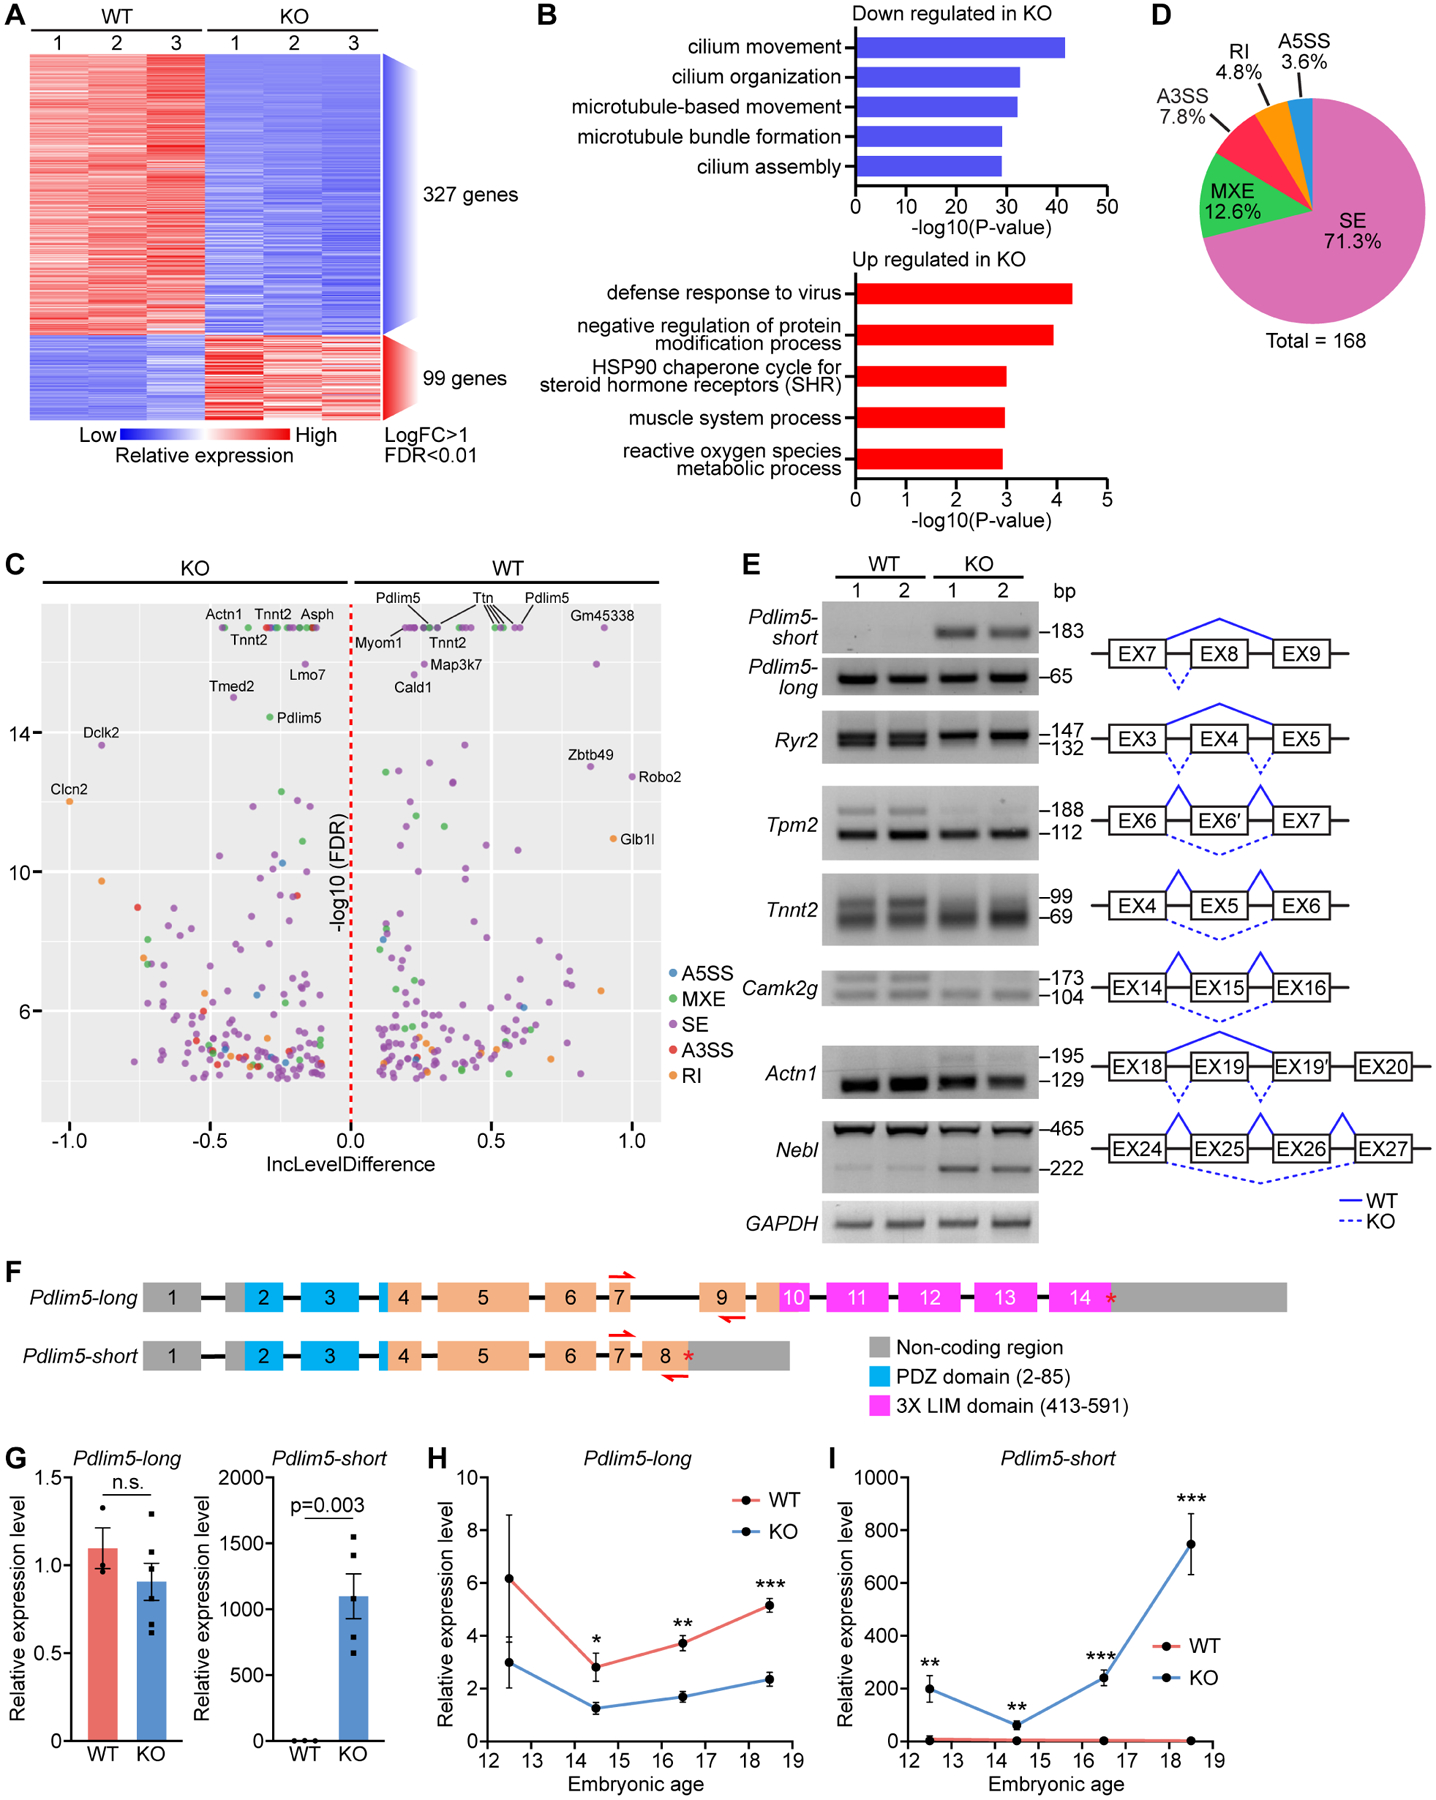
Figure 5. Paired-end RNA sequencing reveals Pdlim5 as a splicing target of RBPMS.

A. Heatmap of differentially expressed genes between WT and KO P1 heart ventricles identified by RNA-seq. B. Top GO terms for down and upregulated genes in KO samples. C. Volcano plot showing the inclusion (Inc) level differences (WT Inclevel – KO Inclevel, X axis) and False Discovery Rates (FDR) for differential alternative splicing events (ASEs) between WT and KO P1 heart ventricles. Y axis is presented as −log10(FDR). D. Pie chart showing the percentage of different ASEs in Rbpms KO mice (FDR<0.01). SE: skipped exon, MXE: mutually exclusive exon, RI: retained intron, A3SS: alternative 3’ splice site, and A5SS: alternative 5’ splice site. E. Representative RT-PCR confirmation of abnormal splicing events in KO heart, and schematic diagram of SE events based on rMATs analysis. Solid lines indicate normal splicing events, and dashed lines indicate abnormal events in KO hearts. F. Schematic of murine Pdlim5 long and short isoform gene structures. Boxes represent exons, different functional domains are labelled with different colors. Red arrows indicate the locations of qRT-PCR primers for determining long and short isoforms expression. G. qRT-PCR of the relative expression of Pdlim5 long and short isoforms in P1 WT and KO heart (n = 3 for WT, and 6 for KO). H, I. qRT-PCR of relative expression levels of Pdlim5-long and short isoforms in WT and KO hearts at different embryonic time points (n = 4–6 for WT or KO). *p<0.05, **p<0.01; ***p<0.001; n.s., not significant. All data are presented as mean ± SEM.
