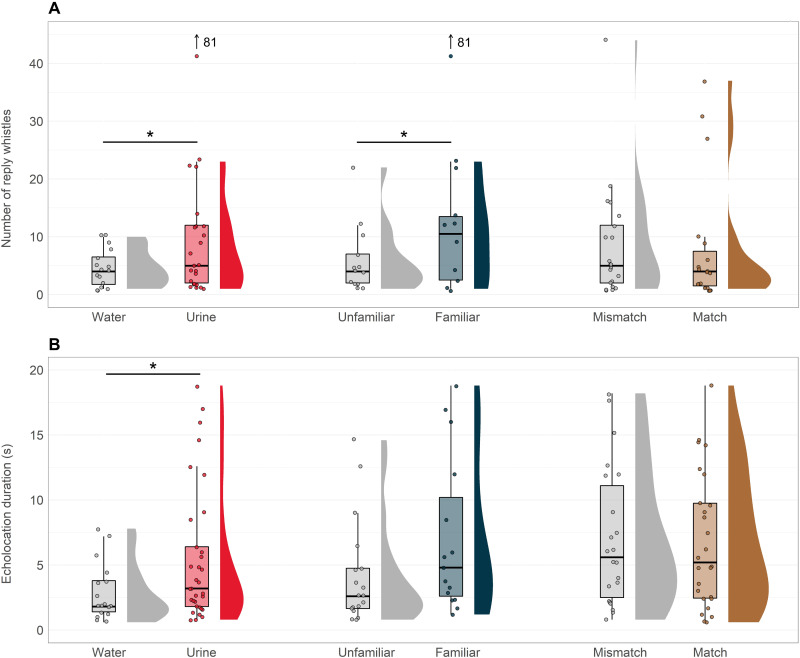
Fig. 3. Vocal responses of dolphins in chemical familiarity and cross-modal experiments.
(A) Boxplots and density curves showing the number of whistles produced by subjects to different experimental stimuli. One outlying point (81 reply whistles produced in response to familiar urine) is referred to but not plotted directly for improved visualization of the central portion of the distribution. (B) Boxplots and density curves showing the duration of echolocation produced by dolphins in response to different experimental stimuli. The asterisks represent statistical significance. Dots represent raw data, while boxes show the interquartile range (IQR) centered on the median response duration, and whiskers show the smallest and largest values up to 1.5 times the IQR.

