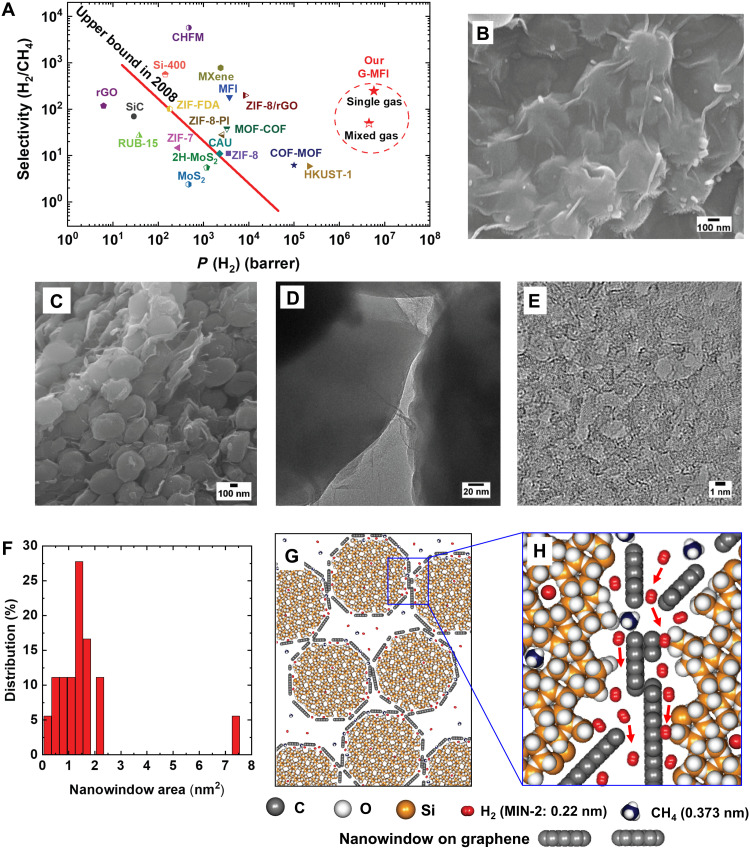
Fig. 1. H2/CH4 separation efficiency achieved with G-MFI.
(A) Robeson plot for H2/CH4 separation for single gas separation. For G-MFI membranes, the selectivity of both single and mixed gas is indicated. The red line refers to the upper bound proposed by Robeson using polymeric membranes (44). Robeson plot details are listed in table S1. (B) G-MFI SEM image. (C) Fractured G-MFI SEM cross-sectional image. (D) TEM image highlighting the contact between two MFI crystals wrapped with graphene. (E) TEM image of nanowindows in graphene. (F) Nanowindow size distribution histogram. (G) Edge share model structure of G-MFI membrane, depicting intergranular voids; the (010) crystallographic face of MFI is shown. (H) Simplified interfacial model showing the cross-sectional view of the graphene and MFI crystal face of the G-MFI membrane. The nanowindows in the single graphene layer are expressed by blanks in the graphene layer, although a graphene layer continuously covers the zeolite crystal. TEM images show a few graphene layers with nanowindows covering an MFI zeolite crystal in the real G-MFI (fig. S4). Few-layer wrapping can be approximated with monolayer wrapping because the gas permeance between the layers is negligible.

