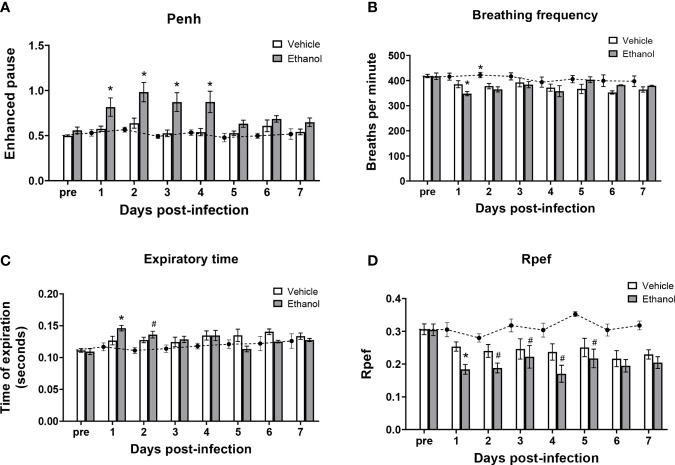
Figure 2.
Effect of ethanol consumption on respiratory function following infection. Enhanced pause (penh) (A), breathing frequency (B), time of respiratory expiration (Te) (C), and Rpef (time to peak expiratory flow as a fraction of Te) (D) were measured by unrestrained whole-body plethysmography before infection and daily for 7 days post-infection. Black circles with dashed line represents values from vehicle-treated uninfected mice; solid bars represent values from infected animals (except for the “pre” values, which were obtained in vehicle- and ethanol-exposed mice prior to infection). Data are presented as mean ± SEM. n = 3-6 mice per group per experiment and data are combined from 3 individual experiments. *p < 0.05 compared to vehicle-exposed infected animals, #p < 0.05 compared to uninfected animals by one-way ANOVA.

