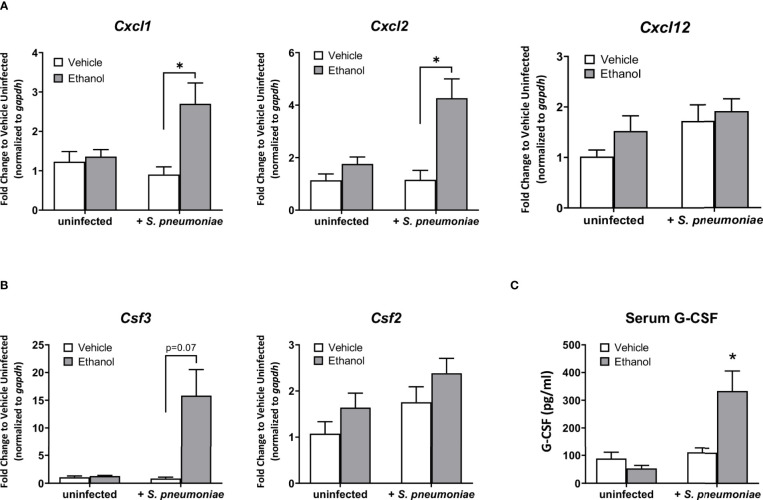
Figure 4.
Effect of ethanol exposure on chemokine gene expression in the lung and serum granulocyte-colony stimulating factor (G-CSF) levels after infection. (A, B) Gene expression as indicated in graph titles was measured as described in Figure 3. Target gene expression is normalized to gapdh and presented as fold change to vehicle-treated uninfected mice. (C) Serum concentration of G-CSF at 24 hours post-infection as measured by ELISA. Data are presented as mean ± SEM. n = 3-5 per group per experiment and represent averages from 3 individual experiments. *p < 0.05 by one-way ANOVA.

