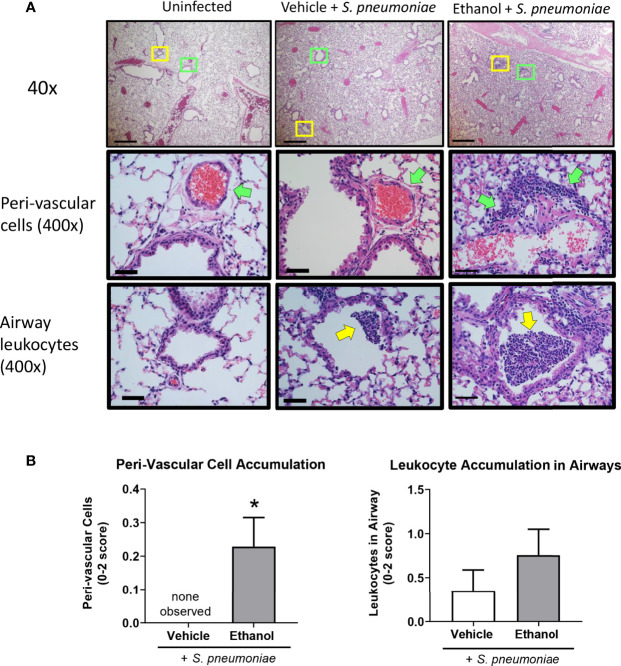
Figure 5.
Effect of ethanol exposure on lung inflammation following S. pneumoniae infection. (A) Representative images of lungs from uninfected and infected mice at 24 hours. Top panel = 40x magnification, scale bar = 500 µm. Boxes denote the magnified areas in the middle and bottom panels. Middle and bottom panels = 400x magnification, scale bar = 50 µm; green arrows denote peri-vascular cells and yellow arrows denote airway leukocytes. (B) Quantitative score for criterion of peri-vascular and airway cell accumulation (0-2 score). Data are presented as mean ± SEM. n = 3-6 mice per group per experiment and data are combined from 2 individual experiments. *p < 0.05 by unpaired t test.

