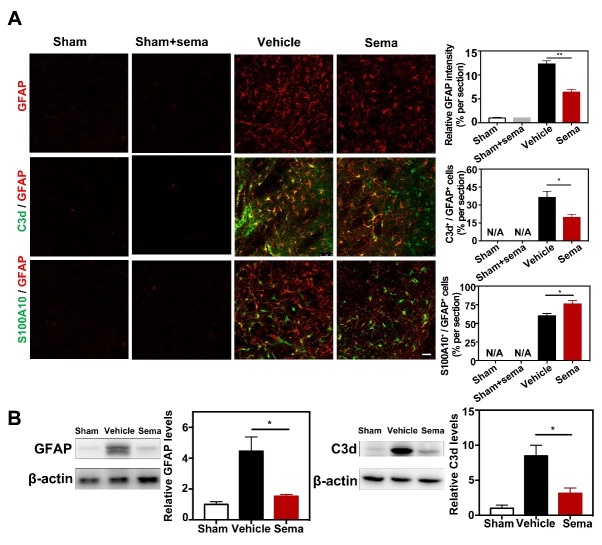
Figure 3.
Semaglutide attenuated astrocytic C3d+ expression after tMCAO. (A) Representative photomicrographs showed that GFAP+ cells, C3d+/GFAP+ cells (C3d in green color; GFAP in red color) and S100A10+/GFAP+ cells (S100A10 in green color; GFAP in red color) in perifocal area of ipsilateral hemisphere in the semaglutide treated tMCAO mice, control mice and sham mice treated with semaglutide, at 3 days following tMCAO. Scale bar=50 μm. Bar graph showed that semi-quantification of GFAP intensity, the percentage of C3d+/GFAP+ cells, and S100A10+/GFAP+ cells. Data are presented as mean±SEM, n=3 per group. *p<0.05, **p<0.01. (B) Western blotting analysis data showed relative GFAP and C3d levels in the perifocal area of ipsilateral hemisphere in the semaglutide treated tMCAO mice and control mice. Data are mean±SEM, n=3 per group. *p<0.05.

