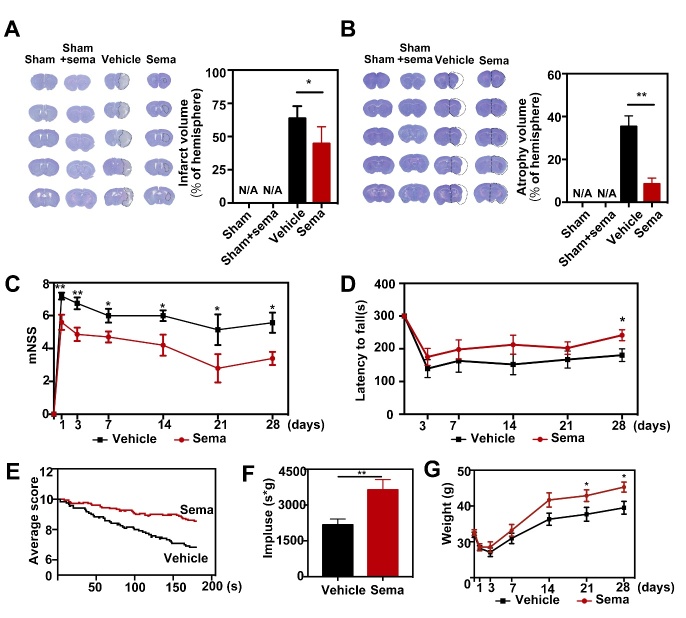
Figure 4.
Inhibiting C3d+/GFAP+ astrocytes formation attenuated infarct volume and neurobehavioral deficit in the semaglutide treated tMCAO mice. (A-B) Cresyl violet-stained coronal sections of the brain in control mice, sham mice treated with semaglutide, tMCAO mice, and semaglutide treated tMCAO mice following 3 (A, infarct) and 28 days (B, atrophy) of tMCAO. The brain infarct area and brain atrophy were circled by the dashed line. Bar graph showed the semi-quantitative analysis of the infarct volume and atrophy volume. Data are mean±SEM, n=6 per group. *p<0.05, **p<0.01. (C-F) Neurobehavioral outcomes were assessed by three neurobehavioral tests including the modified neurological severity score (mNSS, C), rotarod test (D), and hanging wire test (E-F). Line graph showed body weight (G), Data are mean±SEM, n=9-12 per group, **p<0.01, *p<0.05.

