. 2022 May 6;11:e76893. doi: 10.7554/eLife.76893

Figure 1. Strictly defined limits on rare codon usage regulate gene expression.

(A) Top- schematic of each indicated reporter. Bottom- heat map indicating codon usage across each reporter coding sequence. Color key indicates codon usage along the length of the coding sequence. (B–Q) Representative fluorescent images taken under identical camera exposure settings of live male wandering third instar larvae (WL3) containing stable genomic insertions of the indicated GFP reporter. Scalebars are 1 mm. Yellow dashed outlines highlight the larvae in images where no GFP signal was apparent. (R) Western blot protein quantifications of indicated reporters normalized to total protein stain then plotted as percentages relative to GFP0D for whole third instar larvae (two replicates, N=5 each, plotting individual data points and mean ± SEM). Reporters listed in descending order by Codon Adaptation Index (CAI). See Figure 1—figure supplement 1 for blot images. (S) mRNA abundances of the indicated reporters normalized as percentages relative to GFP0D for whole third instar larvae (two replicates, N=5 each, plotting individual data points and mean ± SEM). (T) Histogram of CAI values for each transcript in the Drosophila melanogaster genome. Reporter CAI values are indicated with dotted lines. Full range of endogenous genes highlighted in light gray box.

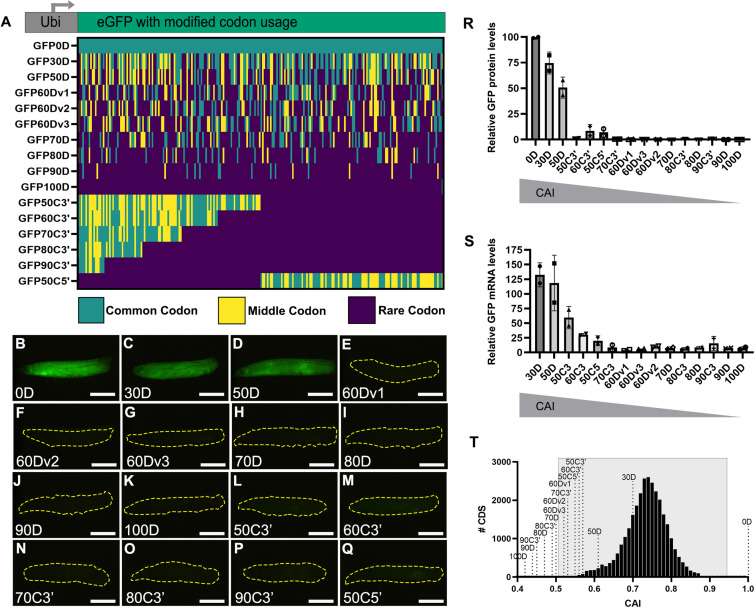
Figure 1.

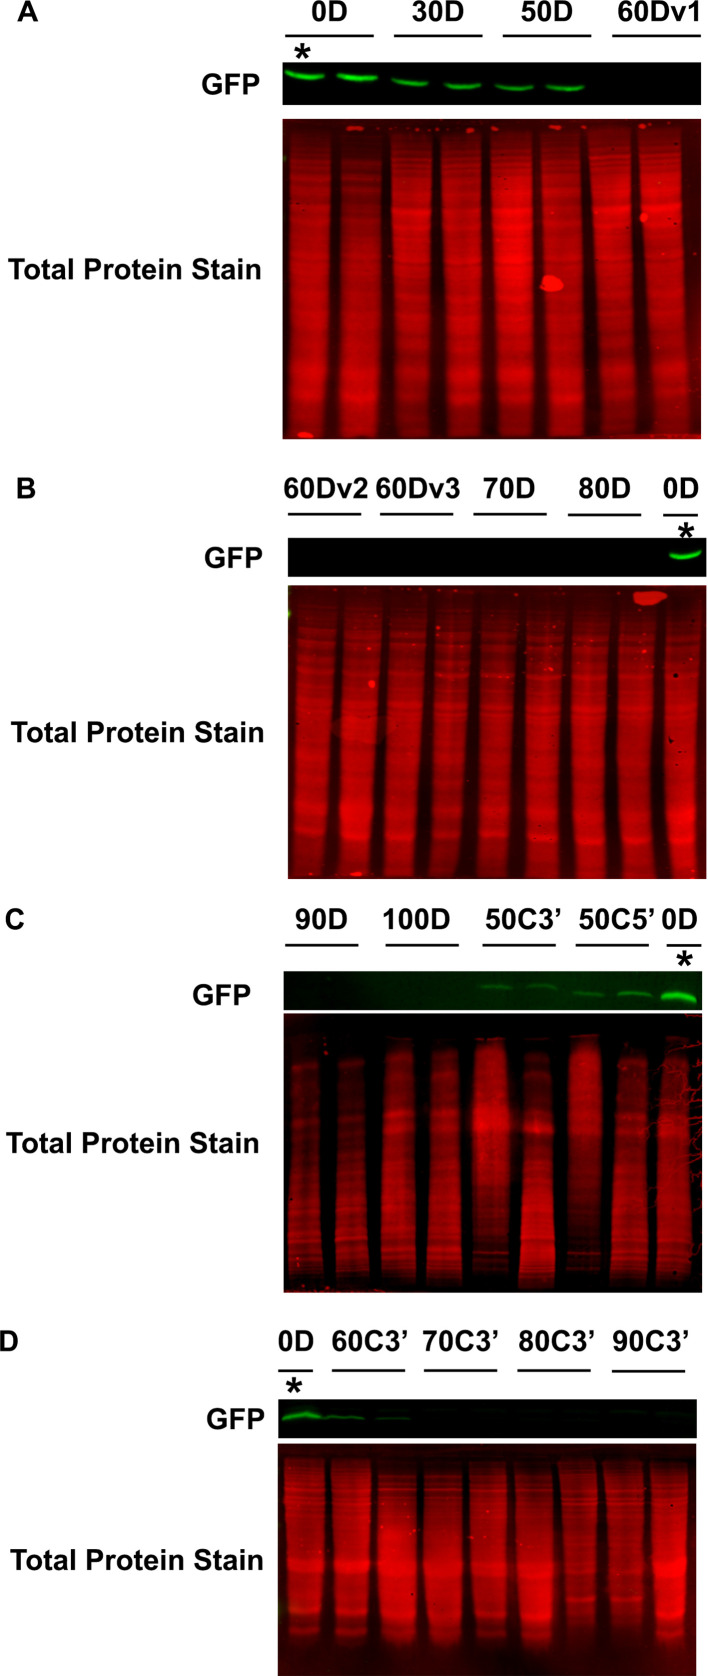
Figure 1—figure supplement 1. Western blots of whole wandering third instar larvae (WL3).

Figure 1—figure supplement 1.

(A–D) Western blots of whole larvae with stable genomic insertions of the indicated reporters, performed in duplicate. Detected GFP signal is indicated by green bands. Total protein stain for each lane is displayed in red directly below the GFP signal bands. *indicates the same GFP0D lysate loaded in each gel for between gels comparisons. We note that the blot in panel C was not loaded evenly and the gel ran sub-optimally, and that this is a caveat to interpretations of protein abundance for reporters GFP90D, GFP100D, GFP50C3’, and GFP50C5’.
Figure 1—figure supplement 1—source data 1. Raw data file and associated PDF figure of uncropped blot presented in Figure 1—figure supplement 1A,B and quantified in Figure 1R.
Blot image was taken in the 800 nm channel and indicates the signal from anti-GFP antibody recognizing transgenic reporter derived GFP protein. Ladder is LI-COR Chameleon Duo pre-stained protein ladder.
Figure 1—figure supplement 1—source data 2. Raw data file and associated PDF figure of uncropped blot presented in Figure 1—figure supplement 1A,B and quantified in Figure 1R.
Blot image was taken in the 700 nm channel and indicates the total protein stain obtained using the LI-COR Revert700 Total Protein Stain kit. Ladder is LI-COR Chameleon Duo pre-stained protein ladder.
Figure 1—figure supplement 1—source data 3. Raw data file and associated PDF figure of uncropped blot presented in Figure 1—figure supplement 1C and quantified in Figure 1R.
Blot image was taken in the 800 nm channel and indicates the signal from anti-GFP antibody recognizing transgenic reporter derived GFP protein. Ladder is LI-COR Chameleon Duo pre-stained protein ladder.
Figure 1—figure supplement 1—source data 4. Raw data file and associated PDF figure of uncropped blot presented in Figure 1—figure supplement 1C and quantified in Figure 1R.
Blot image was taken in the 700 nm channel and indicates the total protein stain obtained using the LI-COR Revert700 Total Protein Stain kit. Ladder is LI-COR Chameleon Duo pre-stained protein ladder.
Figure 1—figure supplement 1—source data 5. Raw data file and associated PDF figure of uncropped blot presented in Figure 1—figure supplement 1D and quantified in Figure 1R.
Blot image was taken in the 800 nm channel and indicates the signal from anti-GFP antibody recognizing transgenic reporter derived GFP protein. Ladder is LI-COR Chameleon Duo pre-stained protein ladder.
Figure 1—figure supplement 1—source data 6. Raw data file and associated PDF figure of uncropped blot presented in Figure 1—figure supplement 1D and quantified in Figure 1R.
Blot image was taken in the 700 nm channel and indicates the total protein stain obtained using the LI-COR Revert700 Total Protein Stain kit. Ladder is LI-COR Chameleon Duo pre-stained protein ladder.
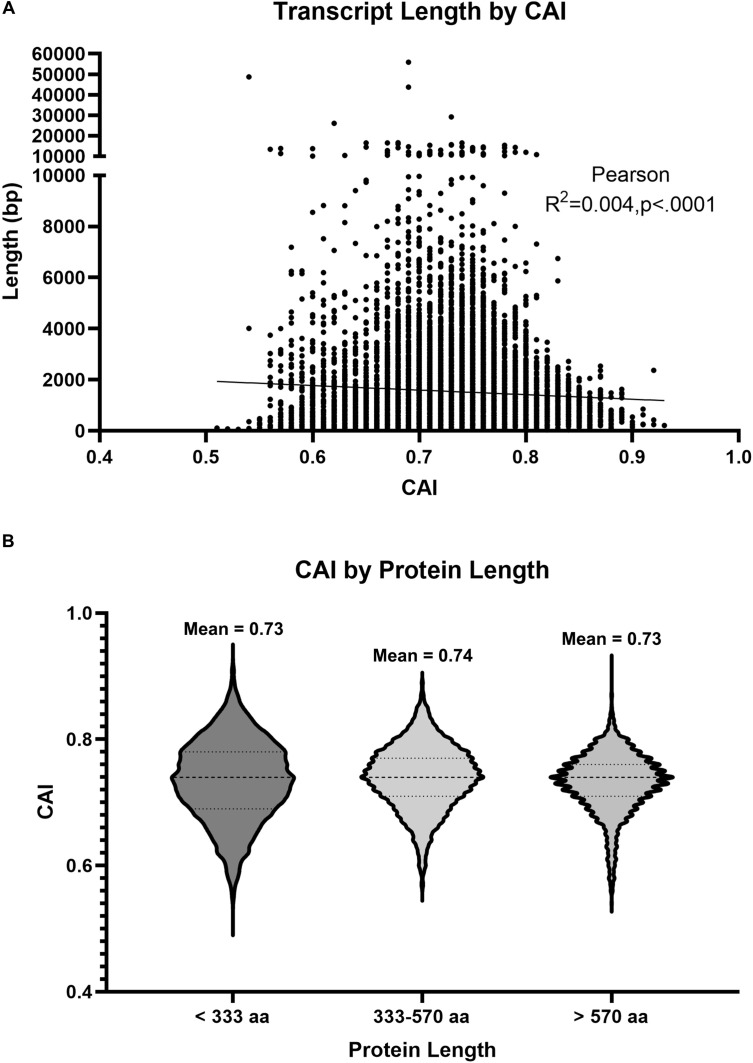
Figure 1—figure supplement 2. Codon Adaptation Index (CAI) is not correlated with gene length.

Figure 1—figure supplement 2.

(A) Scatterplot depicting transcript length as a function of CAI. Each dot represents a single Drosophila transcript. Line represent Pearson’s linear correlation (R2=0.004, p<0.0001). (B) Violin plots depicting the spread of CAI values for protein coding sequences encoding proteins of the indicated size. The size ranges analyzed were chosen for consistency with a previous analysis by Duret and Mouchiroud, 1999.