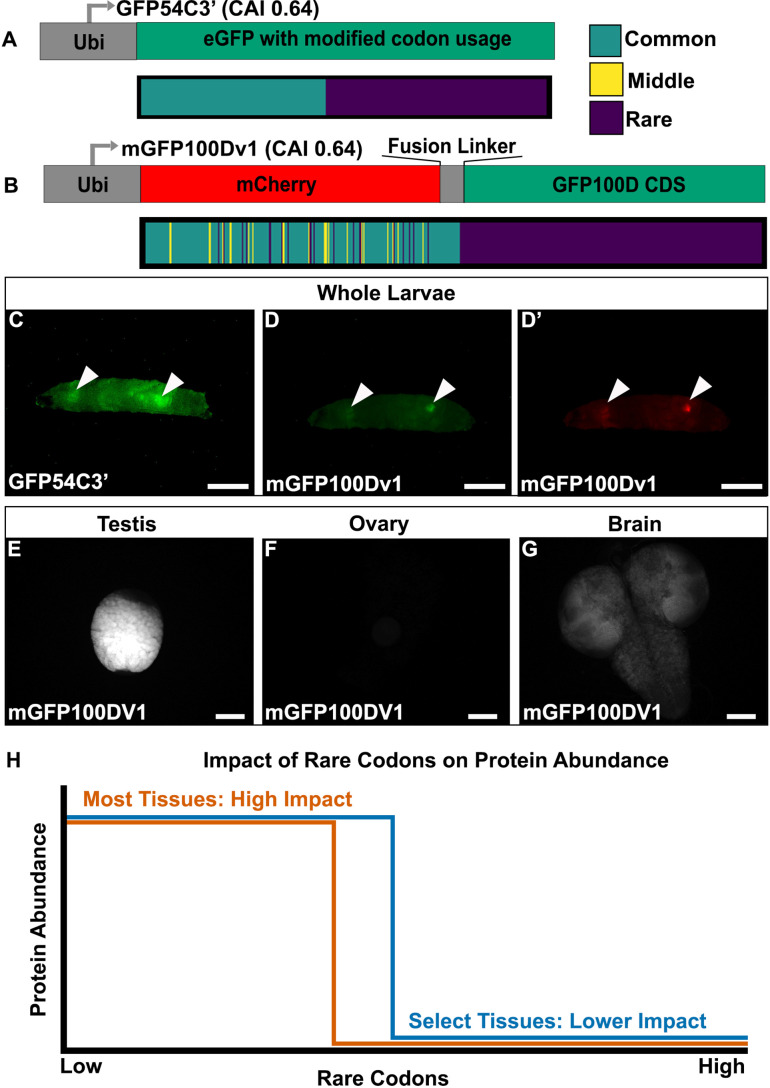
Figure 2. Tissues exhibit distinct responses to rare codons.
(A) Top- reporter design and Bottom- codon usage (see key) along the CDS of GFP54C3’. CAI for GFP54C3’ indicated in parentheses. (B) Top- reporter design and Bottom- codon usage along the CDS of mGFP100Dv1 (see key in panel A). CAI for mGFP100Dv1 indicated in parentheses. (C) Representative fluorescent images of live male wandering third instar larvae (WL3) with stable genomic insertion of GFP54C3’. (D) Representative fluorescent image of live male WL3 larva with stable genomic insertion of mGFP100Dv1 taken at GFP excitation wavelength. (D’) Representative fluorescent image of live male WL3 larva with stable genomic insertion of mGFP100Dv1 taken at mCherry excitation wavelength. Scalebars for (C–D)’ are 1 mm. (E–G) Representative fluorescent images of dissected mGFP100Dv1 larval tissues. Images are taken under identical conditions with fluorescence intensity normalized to testis. Scalebars for (E–G) are 100 µm. (H) Conceptual depiction of tissue-specific differences in rare codon tolerance, as revealed by our reporters. As rare codons increase (moving to the right on the x-axis), protein abundance (y-axis) undergoes a cliff-like decline. However, the point at which select tissues hit the edge of the cliff is distinct.


