. 2022 May 6;11:e76893. doi: 10.7554/eLife.76893

Figure 3. The adult testis and brain robustly express rare codon-enriched reporters.

(A–D) Representative fluorescent images of dissected GFP0D adult tissues. Images are taken under identical conditions with fluorescence intensity normalized to testis. (E–H) Representative fluorescent images of dissected mGFP100Dv1 adult tissues. Images are taken under identical conditions with fluorescence intensity normalized to testis. (I–L’) Confocal images of adult GFP54C3’ testis immunostained with antibodies recognizing the indicated cell types. Arrowheads indicate cells of interest, I, I’ = germ cells, J, J’=hub, K, K’=somatic cyst cells. Right image in each pair shows the GFP only channel from the left image in the pair. (L’L’) Confocal image of adult GFP0D testis immunostained with Eya. Arrowheads = somatic cyst cells. (L’) GFP only channel of image in (L) (M) mGFP100Dv1 protein abundance in dissected adult tissues measured by western blot and plotted as a percentage relative to GFP0D (three replicates, N=10–12 animals each, plotting mean ± SEM, Dunnett’s multiple comparison to testis, *p<0.05, ***p≤0.001). See Figure 3—figure supplement 1 for representative blot image. (N) Steady state mRNA levels for heterozygous mGFP100Dv1/GFP0D expressing animals measured by Quantitative Real-Time PCR (qRT-PCR). mGFP100Dv1 mRNA levels are plotted as a percentage relative to GFP0D within each tissue. (2–3 replicates, N=10 animals each, plotting mean ± SEM, Dunnett’s multiple comparison to testis, ***p=0.0001,****p<0.0001). (O) Translation efficiency of mGFP100Dv1 in each tissue plotted as a percentage relative to GFP0D, plotting mean value. See Methods for details. Scalebars are 100 µm. AG = accessory gland.

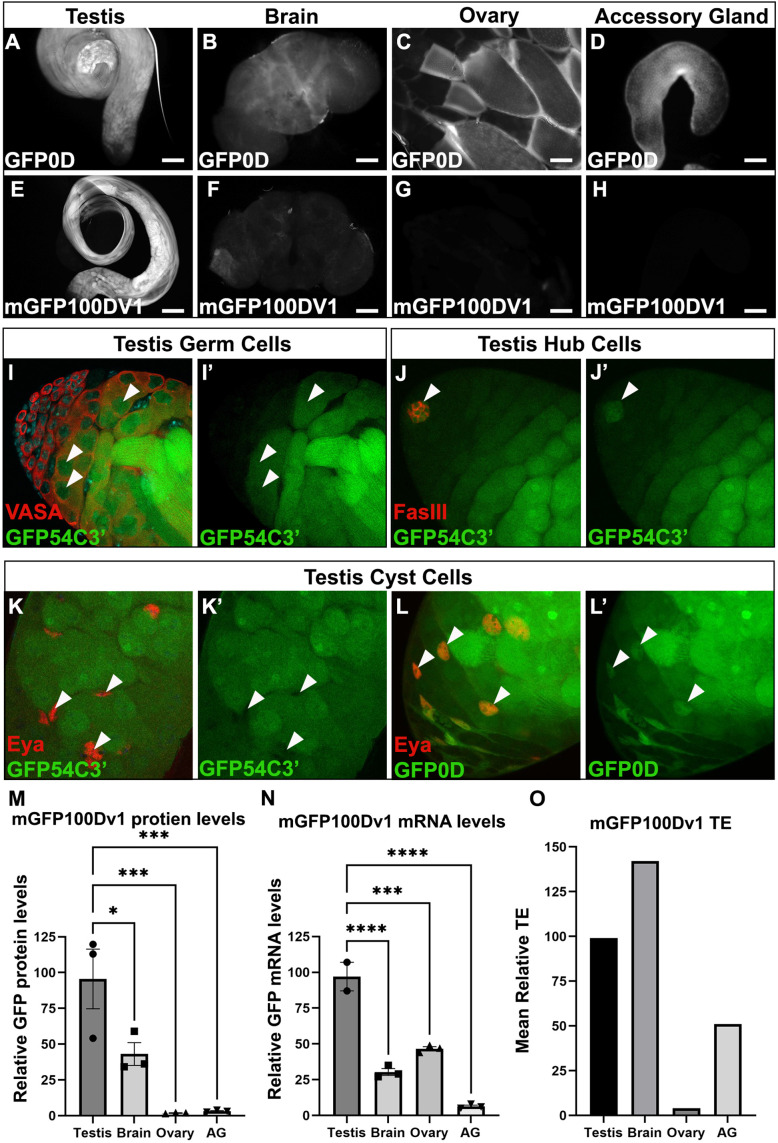
Figure 3.

Figure 3—figure supplement 1. Western blot for adult tissues.

Figure 3—figure supplement 1.

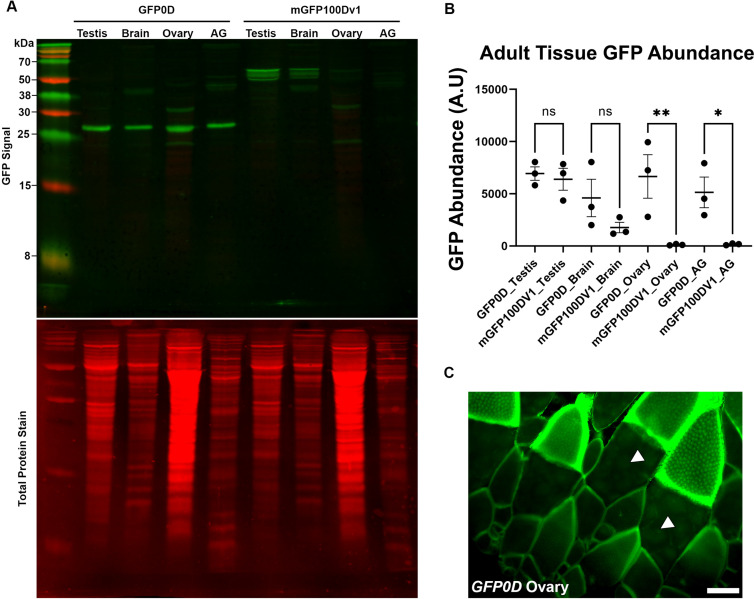
(A) Representative western blot for dissected adult tissues (N=10–12 per tissue, 10–12 pairs for testis, ovary, and accessory gland (AG)), three replicates performed in total, quantified using alternative methods in Figure 3M and in panel (B). GFP signal is indicated by green bands. For GFP0D the prominent band around 27 kDa was quantified. For mGFP100Dv1, the three closely adjacent bands around 55 kDa were quantified. These bands may represent post-translational modifications to mGFP100Dv1 as they are not detected in GFP0D animals, indicating that they are unlikely to be non-specific. We note the presence of a non-specific band detected in brains of both GFP0D and mGFP100Dv1 animals around 38 kDa, and two non-specific bands detected in ovary of both GFP0D and mGFP100Dv1 animals around 20 kDa and 30 kDa respectively. We believe these bands to be non-specific given that mGFP100Dv1 protein is twice as large as GFP0D, yet the bands are of identical size, rendering it highly unlikely that these bands represent reporter-derived protein products. Total protein stain for each lane is displayed in red directly below the GFP channel image. (B) Quantitation of GFP protein abundance in dissected adult tissues measured by western blot for GFP0D and mGFP100Dv1 animals normalized to total protein stain (three replicates, N=10–12 animals each, plotting mean ± SEM, Bonferroni-Šídák, ns = p>0.05, *p<0.05, **p<0.01). (C) Fluorescent image of an ovary from a GFP0D transgenic animal depicting that GFP0D protein is detectable in the germline at reduced levels relative to the soma. Arrowheads indicate germline cells. Scalebar is 100 µm.
Figure 3—figure supplement 1—source data 1. Raw data file and associated PDF figure of uncropped blot presented in Figure 3—figure supplement 1A and quantified in Figure 3—figure supplement 1B and Figure 3M.
Blot image was taken in the 800 nm channel and indicates the signal from anti-GFP antibody recognizing transgenic reporter derived GFP protein. Ladder is LI-COR Chameleon Duo pre-stained protein ladder.
Figure 3—figure supplement 1—source data 2. Raw data file and associated PDF figure of uncropped blot presented in Figure 3—figure supplement 1A and quantified in Figure 3—figure supplement 1B and Figure 3M.
Blot image was taken in the 700 nm channel and indicates the total protein stain obtained using the LI-COR Revert700 Total Protein Stain kit. Ladder is LI-COR Chameleon Duo pre-stained protein ladder.
Figure 3—figure supplement 1—source data 3. Raw data file and associated PDF figure of uncropped blot quantified in Figure 3—figure supplement 1B, and Figure 3M.
Blot image was taken in the 800 nm channel and indicates the signal from anti-GFP antibody recognizing transgenic reporter derived GFP protein. Ladder is LI-COR Chameleon Duo pre-stained protein ladder.
Figure 3—figure supplement 1—source data 4. Raw data file and associated PDF figure of uncropped blot quantified in Figure 3—figure supplement 1B, and Figure 3M.
Blot image was taken in the 700 nm channel and indicates the total protein stain obtained using the LI-COR Revert700 Total Protein Stain kit. Ladder is LI-COR Chameleon Duo pre-stained protein ladder.
Figure 3—figure supplement 2. The brains of both sexes robustly express rare codon-enriched reporters.

Figure 3—figure supplement 2.

(A) Fluorescent image of a dissected brain from an adult Drosophila with no transgenic GFP reporter. Image is taken under identical conditions as (B–C) with fluorescence intensity normalized to male mGFP100Dv1 brain. Nuclei are stained with DAPI, indicated in blue. GFP channel signal, indicated in green, represents autofluorescence. (B–C) Fluorescent images of dissected brains from adult Drosophila with stable genomic insertion of mGFP100Dv1. Images are taken under identical conditions with fluorescence intensity normalized to male mGFP100Dv1 brain. Nuclei are stained with DAPI, indicated in blue. GFP channel signal, indicated in green, is from the mGFP100Dv1 reporter.
Figure 3—figure supplement 3. Tissue-specific expression is not dependent on the genomic locus of transgene insertion.

Figure 3—figure supplement 3.

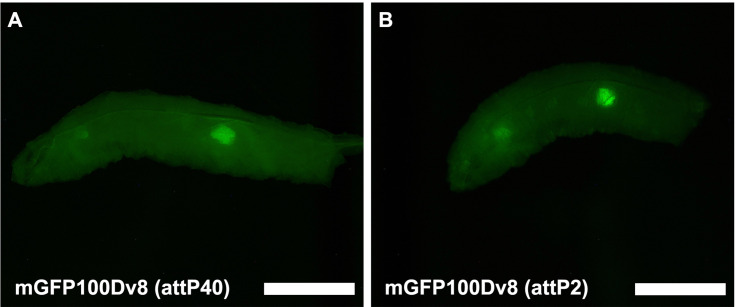
(A) Fluorescent image taken in the GFP excitation channel of a live male wandering third instar larvae (WL3) with stable genomic insertion of mGFP100Dv8 into site attP40 on chromosome II. (B) Fluorescent image taken in the GFP excitation channel of a live male WL3 larva with stable genomic insertion of mGFP100Dv8 into site attP2 on chromosome III. Scalebars are approximately 1 mm.
Figure 3—figure supplement 4. mRNA length from indicated transgenes.

Figure 3—figure supplement 4.

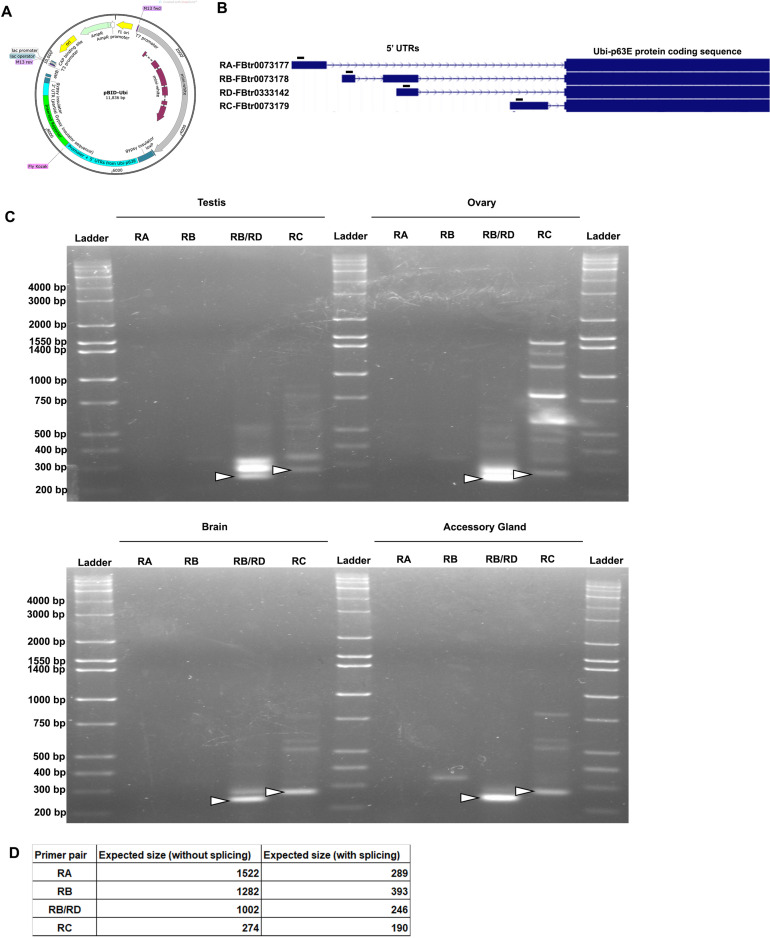
(A) Plasmid map of the pBID-Ubi vector depicting key features. Of note are the Ubi-p63 promoter sequence, which contains the 5’ UTR sequences of the Drosophila Ubi-p63E gene, and the 3’ UTR which consists of a partial Gypsy transposon insulator sequence as determined by 3’ RACE (See Methods). Plasmid map created using SnapGene software (from Insightful Science; available at snapgene.com) (B) UCSC genome browser tracks of the four Drosophila Ubi-p63E transcript isoforms and their respective 5’ UTRs. Black rectangles mark the forward primer binding sites for RT-PCR amplification in panel C. (C) RT-PCR products separated by gel electrophoresis for predicted alternative 5’ UTRs derived from the Ubi-p63E promoter. RT-PCR was performed on cDNA from either testis, ovary, brain, or accessory glands of mGFP100Dv1 animals using isoform-specific forward primers indicated in panel B and a reverse primer in the 5’ end of the mGFP100Dv1 coding sequence. Primer pairs were validated to amplify a single band of expected size from genomic DNA, however, several non-specific bands were detected when performing RT-PCR. Arrowheads indicate bands of interest, which were verified by gel extraction and sequencing for testis and ovary. Importantly, bands of interest do not differ between tissues. Of note, the prominent non-specific band detected by the RB/RD isoform-specific primer in both testis and ovary, which is only slightly larger than the band of expected size, lacks significant homology with our mGFP100Dv1 reporter and shares 98% identity with the Drosophila endogenous transcript for the gene belphegor. We also note that the RB/RD specific primer yielded a band of the expected size, whereas the RB specific primer yielded no bands of expected size, suggesting that the band in the RB/RD lane is predominantly derived from isoform RD. (D) Table of expected RT-PCR band sizes with or without splicing of introns. Note that only the spliced band size is detected for isoform RD and only the unspliced band size is detected for isoform RC. Impaired splicing of isoform RC is likely due to the presence of a sequencing-verified T>A SNP in the 5’ GT splice signature of the intron.