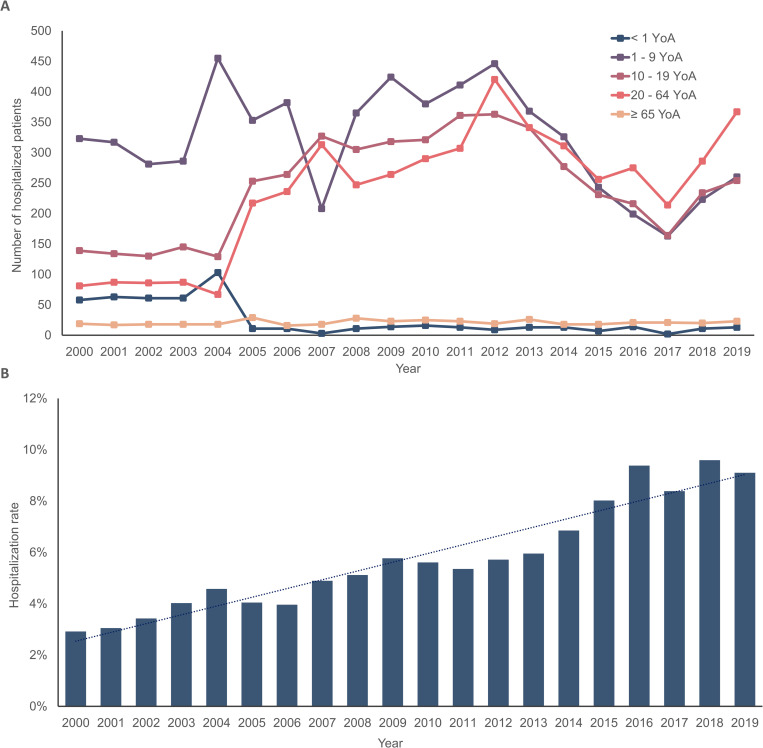
Fig 3. Total number of hospitalizations and hospitalization rates for HAV infection by age groups in Mexico throughout the observation period (2000–2019).
A) Total sum of patients hospitalized for HAV infection by age group in Mexico throughout the observation period (2000–2019). B) Hospitalization rate due to HAV infection by year in Mexico throughout the observation period (2000–2019). HAV, hepatitis A virus; YoA, years of age.

