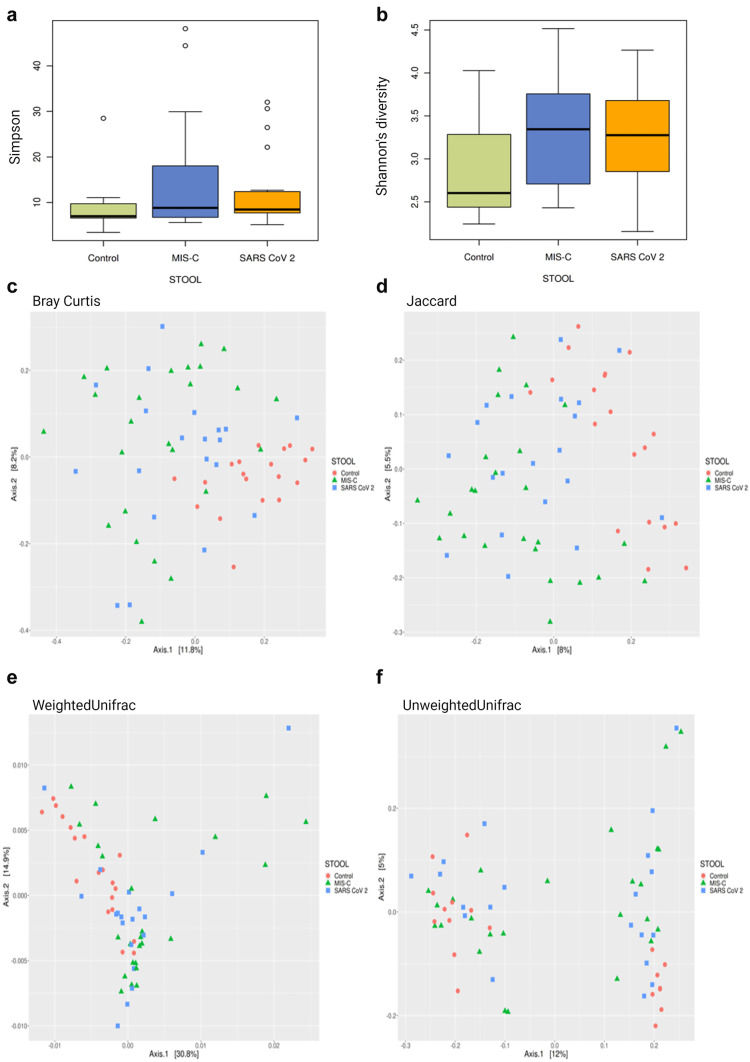
Fig. 2.
Alpha and beta diversity plots to visualize the difference in microbiota structure between the MIS-C, SARS-CoV-2, and control groups. Simpson index comparison between the study groups. There was no significant difference in stool sample data between the groups in the study (p > 0.05). a Shannon index comparison between the study groups. Shannon index was higher in stool sample data of MIS-C cases when the control group (p < 0.01). b PCoA 2D plots of beta diversity analysis of the MIS-C, SARS-CoV-2, and control groups. Each dot represents a stool sample. Red circle, green triangle, and blue square represent control, MIS-C, and SARS-CoV-2 cases, respectively. c–f Between-sample dissimilarities were measured by Bray–Curtis distances (c), Jaccard distance (d), weighted UniFrac distances (e), and unweighted UniFrac distances (f). A statistical difference in the stool samples was found between the groups in the results of the Bray–Curtis (c), Jaccard (d), weighted UniFrac (e), and unweighted UniFrac (f) baseline coordinate analysis (PCoA) (p = 0.001)

