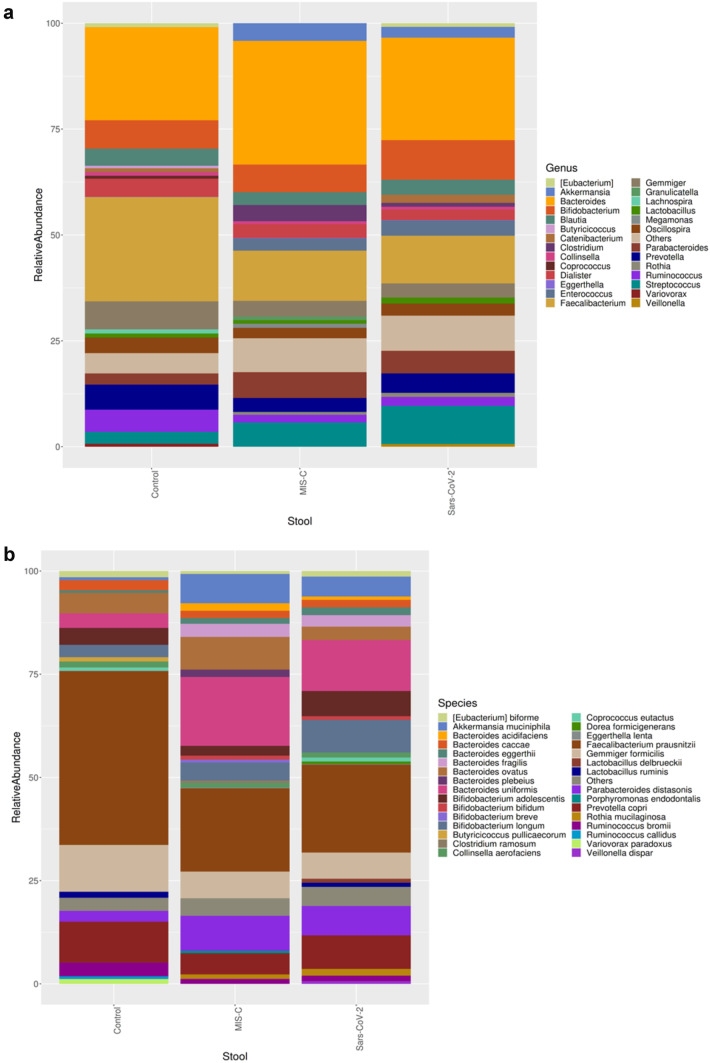
Fig. 3.
Intestinal microbiota composition of the study groups at species and genus levels. Bacterial community relative abundance analysis at the genus (a) and species (b) levels (relative abundance > 1%; bacteria with relative abundances < 1% were pooled in the “others” category and sorted by total concentration)

