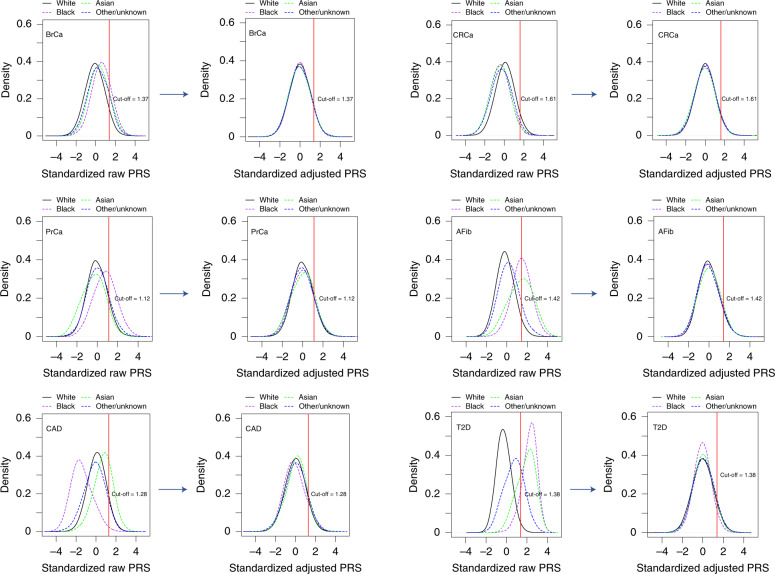
Fig. 3. PRS distributions by reported race before and after adjustment for population structure.
Plots to the left of each arrow show the distributions of unadjusted published PRS (PRSstd-raw) by race for each of six diseases in up to 36,423 MGBB participants. Plots to the right of each arrow show these distributions after adjustment for population structure (PRSstd-adj), as described in the text. The red vertical line indicates the standardized PRS threshold corresponding to OR > 2 for each disease, based on the OR per standard deviation from the original publication.

