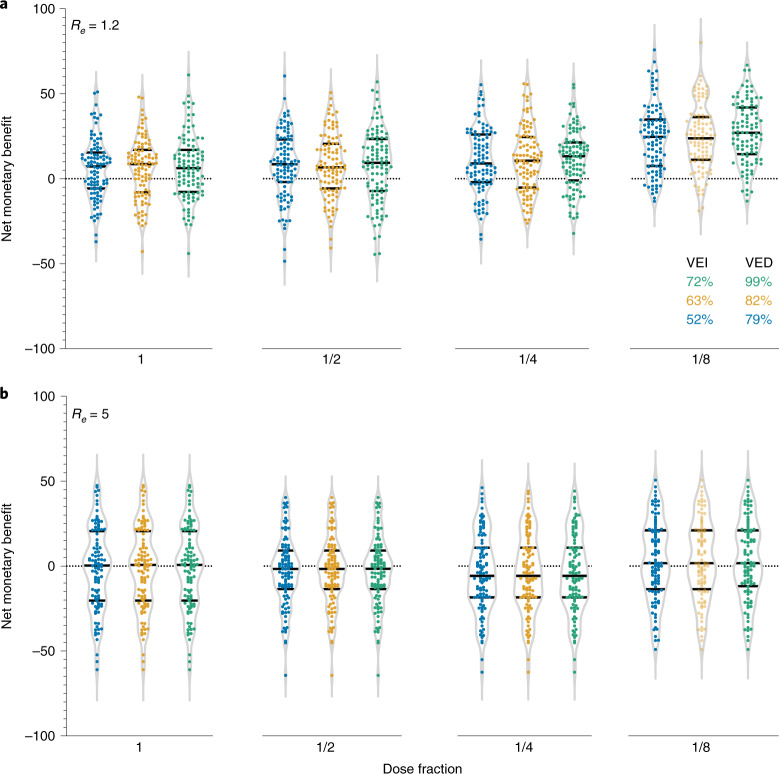
Fig. 1. Estimation of the expected gain in the NMB for each vaccination strategy as compared to the status quo strategy (that is, no vaccination) in India.
a, Estimation given the effective reproductive number Re = 1.2. b, Estimation given Re = 5. In a and b, each sub-panel from left to right corresponds to the two-dose vaccination using full dosing, 1/2 dosing, 1/4 dosing and 1/8 dosing, respectively. Each dot indicates one realization of the 100 stochastic simulations. Color scheme indicates the vaccine efficacy against infection (VEI) and vaccine efficacy against symptomatic disease (VED). The WTP per averted YLL per age group is based on data from the Centre for Monitoring Indian Economy’s Consumer Pyramids Household Survey35 (Methods). Extended Data Fig. 2 provides the sensitivity analyses using other possible WTP per averted YLL.

