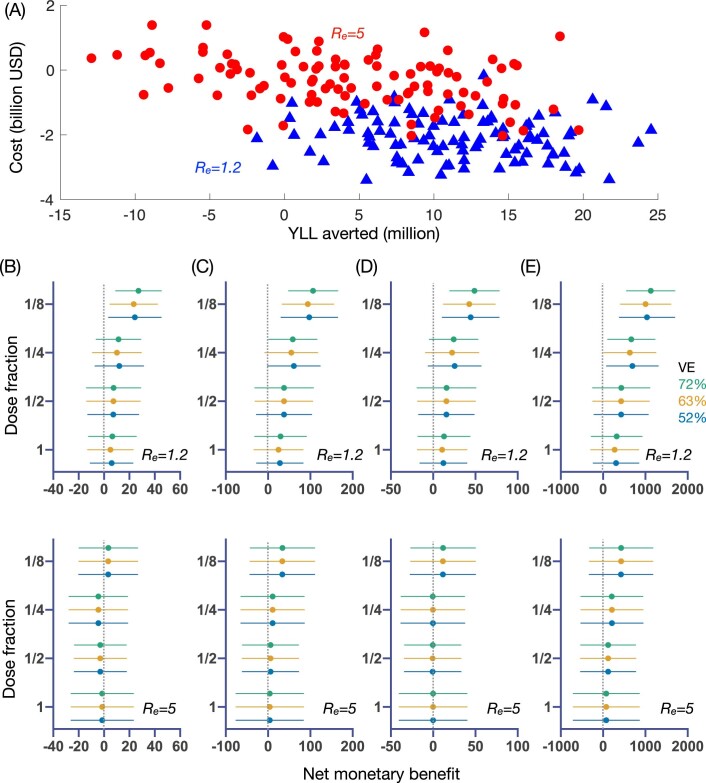
Extended Data Fig. 2. Estimation of the expected gain in the net monetary benefit (NMB) for each fractional-dose strategy as compared to status quo in India.
(A) An example for the estimated costs of fractionated dose strategies versus the averted years of life lost (YLLs) with reference to the no vaccine strategy. Each dot indicates one realization of the 100 stochastic simulations, given the use of 1/8 dose fractionation strategy with 72% vaccine efficacy against infection (VE) (blue triangle and red circle indicate the estimates given effective reproductive number Re = 1.2 and 5, respectively) and willingness to pay (WTP) per YLL averted of US$1,097, US$1,251, US$2,977, US$3,150, and US$3,205 for five age groups (0-5, 6-17, 18-49, 50-64, and > 65), respectively. (B) Estimated distributions for the expected gain in the NMB (2021 $ billion) over various vaccine efficacy against infection and fractional-dose strategy, given vaccine cost of US$12 and willingness to pay (WTP) per YLL averted of US$1,097, US$1,251, US$2,977, US$3,150, and US$3,205 for five age groups (0-5, 6-17, 18-49, 50-64, and > 65), respectively. Dots and error bars indicate the estimated mean and standard deviations, respectively. Colour scheme corresponds to the vaccine efficacy against infection. (C) Same as (B) but setting the WTP per averted YLL as US$10,517. (D) Same as (B) but setting the WTP per averted YLL as US$5089 (i.e., as in other middle-income countries such as Thailand). (E) Same as (B) but setting the WTP per averted YLL as US$100,000 (i.e., as in high-income countries such as theUS). Each subpanel in (B) to (E) uses 100 stochastic realizations to simulate theCOVID-19 transmission over each possible vaccine efficacy against infection (between 52% and 72%) and transmissibility (with effective reproduction number Re = 1.2 or 5). The optimal strategy given each transmission scenario is always estimated to be strategies with higher-fold fractionations, even if the vaccine efficacy against infection is not high. See Methods for the calculation of the NMB and supplementary materials for detailed values of vaccine costs and efficacy parameters.

