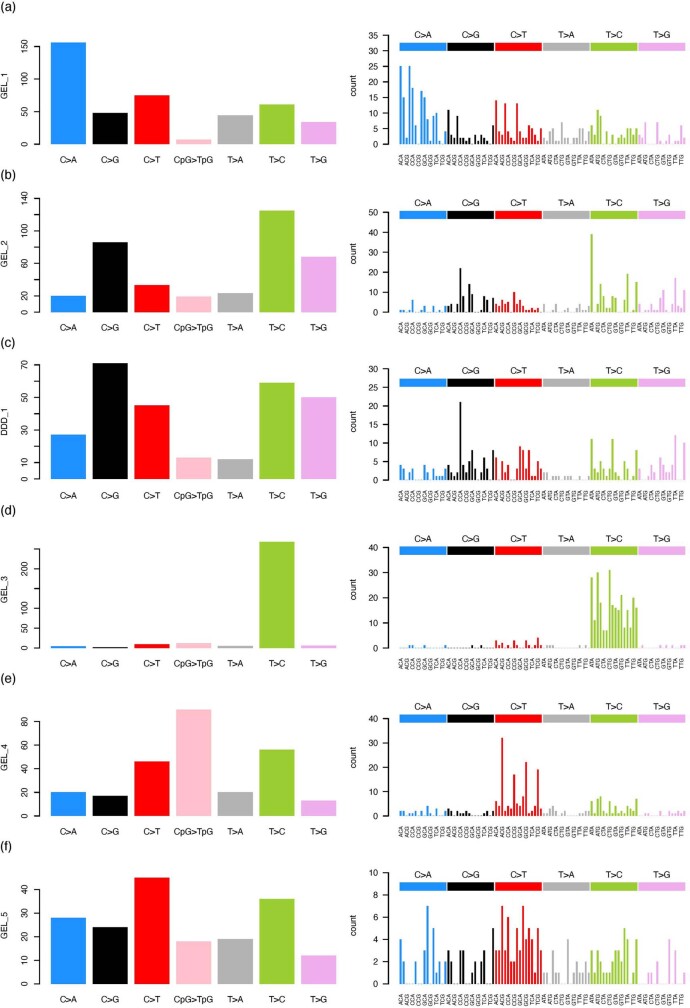
Extended Data Fig. 3. Mutational spectra for the DNMs of hypermutated individuals part 1.
(a–f correspond to individual GEL_1, GEL_2, DDD_1, GEL_3, GEL_4, and GEL_5 respectively). Each row is a hypermutated individual showing the mutational spectra according to count of mutations per each single base change (with CpG>TpG mutations separated from other C>T mutations) and the second plot is the mutation count for all 96 mutations in their trinucleotide context. The x-axis demonstrates the reference trinucleotide sequence with the mutated base highlighted. The colour and label on the bar above indicates the mutation type.

