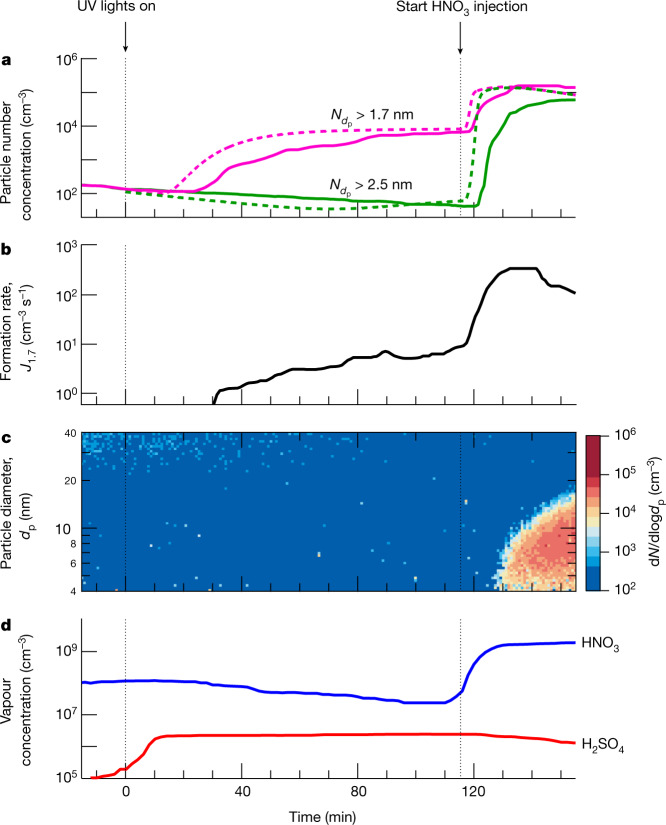
Fig. 1. Example experiment showing nitric acid enhancement of H2SO4–NH3 particle formation.
a, Particle number concentrations versus time at mobility diameters >1.7 nm (magenta) and >2.5 nm (green). The solid magenta trace is measured by a PSM1.7 and the solid green trace is measured by a CPC2.5. The fixed experimental conditions are about 6.5 × 108 cm−3 NH3, 223 K and 25% relative humidity. A microphysical model reproduces the main features of the observed particle formation (dashed lines; see text for details). b, Particle formation rate versus time at 1.7 nm (J1.7), measured by a PSM. c, Particle size distribution versus time, measured by an SMPS. d, Gas-phase nitric acid and sulfuric acid versus time, measured by an I− CIMS and a NO3− CIMS, respectively. Sulfuric acid through SO2 oxidation started to appear soon after switching on the UV lights at time = 0 min, building up to a steady state of 2.3 × 106 cm−3 after a wall-loss-rate timescale of around 10 min. The subsequent H2SO4–NH3 nucleation led to a relatively slow formation rate of 1.7-nm particles. The particles did not grow above 2.5 nm because of their slow growth rate and corresponding low survival probability against wall loss. Following injection of 2.0 × 109 cm−3 nitric acid into the chamber after 115 min, while leaving the production rate of sulfuric acid and the injection rate of ammonia unchanged, we observed a sharp increase in particle formation rate (panel b), together with rapid particle growth of 40 nm h−1 (panel c). The overall systematic scale uncertainties of ±30% on particle formation rate, −33%/+50% on sulfuric acid concentration and ±25% on nitric acid concentration are not shown.

