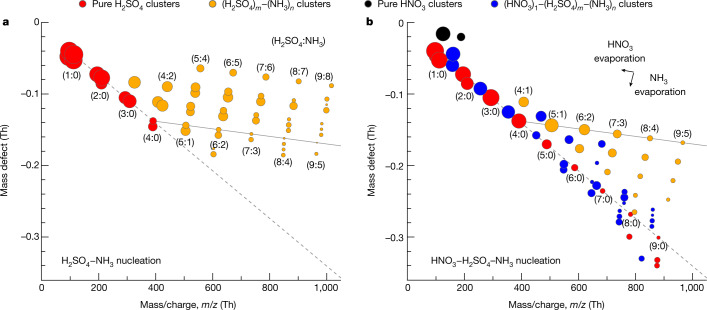
Fig. 3. Molecular composition of negatively charged clusters during H2SO4–NH3 and HNO3–H2SO4–NH3 nucleation events at 223 K and 25% relative humidity.
Mass defect (difference from integer mass) versus mass/charge (m/z) of negatively charged clusters measured with an APi-TOF mass spectrometer for 1.7 × 106 cm−3 sulfuric acid and 6.5 × 108 cm−3 ammonia (a) and 2.0 × 107 cm−3 sulfuric acid, 3.2 × 109 cm−3 nitric acid and 7.9 × 109 cm−3 ammonia (b). The symbol colours indicate the molecular composition as shown. The symbol area is proportional to the logarithm of signal rate (counts per second). The labels (m:n) near the symbols indicate the number of sulfuric acid (H2SO4)m and ammonia (NH3)n molecules in the clusters, including both neutral and charged species. The grey dashed lines follow clusters that contain pure H2SO4 molecules with an HSO4− ion (or SO4 instead of H2SO4 and/or SO4− instead of HSO4− for pure H2SO4 clusters falling below this line in b). The grey solid lines follow the 1:1 H2SO4–NH3 addition starting at (H2SO4)4–(NH3)0. Nearly all clusters in panel a lie above this line, whereas nearly all clusters in panel b fall below it. Most clusters containing HNO3 lack NH3 by the time they are measured (they fall near the (m:0) grey dashed line), but the marked difference between a and b indicates that the nucleating clusters had distinctly different compositions, probably including relatively weakly bound HNO3–NH3 pairs in b. It is probable that nucleating clusters in the CLOUD chamber at 223 K contain HNO3–H2SO4–NH3 with a roughly 1:1 acid–base ratio. However, during the transmission from the chamber to the warm APi-TOF mass spectrometer at 293 K, the clusters lose HNO3 and NH3, leaving a less volatile core of H2SO4 with depleted NH3. The evaporation of a single NH3 or HNO3 molecule from a cluster displaces it on the mass defect plot by a vector distance indicated by the black arrows in b.

