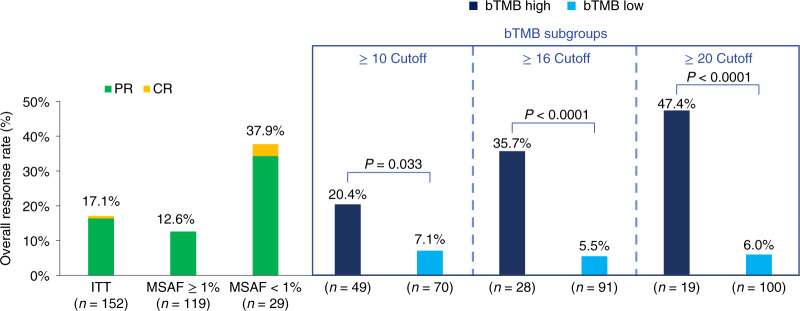
Fig. 1. Confirmed responses with atezolizumab.
ORRs are shown for bTMB-high (dark blue) and bTMB-low (light blue) subgroups at three different cutoffs, all of which showed significant differences between the subgroups. Data cut: 26 July 2019. Statistical tests (Cochran–Mantel–Haenszel) were unadjusted for multiple comparisons and two-sided at the 0.10 significance level. Rate difference (90% CI): bTMB ≥ 10, 13.3% (2.5, 24.0); bTMB ≥ 16, 30.2% (14.8, 45.6); and bTMB ≥ 20, 41.4% (22.1, 60.6). CR, complete response; PR, partial response.

