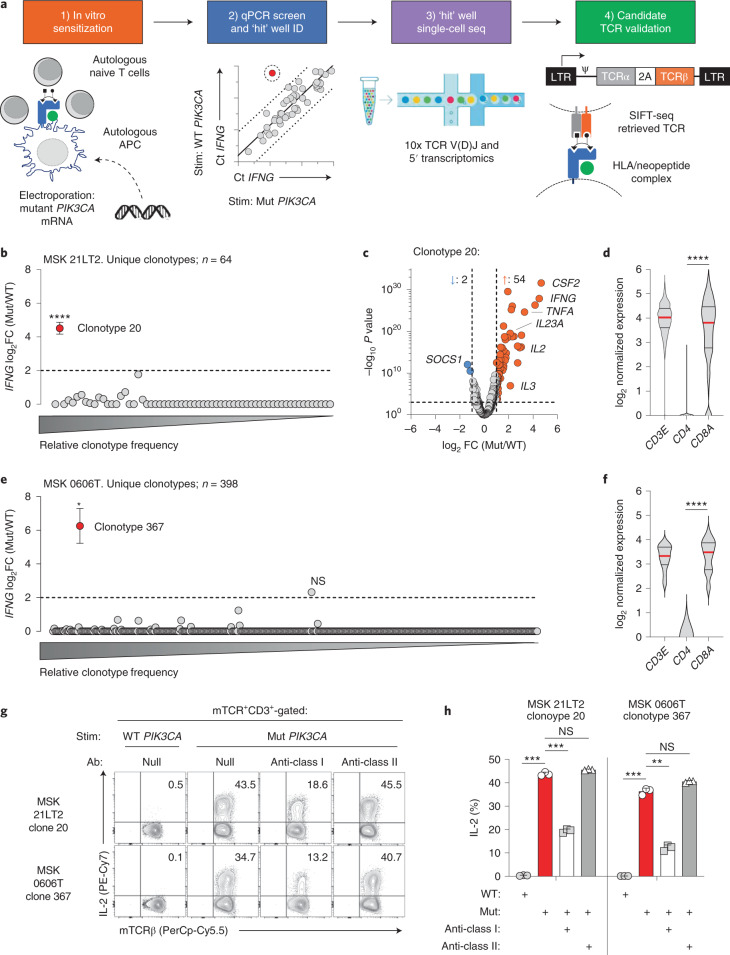
Fig. 1. Development and validation of the SIFT-seq discovery platform for Mut PIK3CA-specific TCRs.
a, Schematic overview of the SIFT-seq TCR discovery platform. b, log2 fold change (FC) ratio of IFNG transcripts from n = 64 unique TCR clonotypes identified using single-cell RNA and V(D)J TCR sequencing from screen-positive ‘hit’ well MSK 21LT2. Matched aliquots of sensitized T cells from HD1 were stimulated with PIK3CA (H1047L) (Mut) or WT PIK3CA before single-cell sequencing. The mean IFNG ratio for all evaluable TCR clonotypes is shown. Statistical analyses were performed for all clonotypes with a minimal ratio of ≥2 (dashed line). The x axis indicates the relative frequencies of individual TCR clonotypes. ****P = 1.37 × 10⁻²⁸ using two-sided Welch’s t-test. c, Volcano plot displaying global transcriptomic changes for MSK 21LT2 clonotype 20 after stimulation with Mut versus WT PIK3CA. Vertical and horizontal dashed lines indicate thresholds for log2 gene expression FC and statistical significance, respectively. Orange and blue dots represent significantly upregulated and downregulated genes after Mut PIK3CA stimulation, respectively. d, Violin plots depicting transcript levels for the lineage markers CD3E, CD4 and CD8A from MSK 21LT2 clonotype 20. ****P < 0.0001 using two-sided Student’s t-test. e, log2 FC ratio of IFNG transcripts from n = 398 unique TCR clonotypes identified using single-cell sequencing from screen-positive ‘hit’ well MSK 06006T derived from HD2. *P = 1.41 × 10⁻⁵ using two-sided Welch’s t-test. NS, not significant. f, Violin plots depicting lineage marker transcript expression for MSK 0606T clonotype 367. ****P < 0.0001 using two-sided Student’s t-test. Representative FACS plots (g) and summary bar graph (h) (n = 3 biologically independent replicates per condition) displaying the frequency of intracellular IL-2 production in polyclonal T cells following retroviral transduction with SIFT-seq-retrieved TCR candidates. The reconstructed TCR expresses a murine constant chain (mTCR), enabling detection with an anti-mTCR-specific antibody. Transduced T cells (live+mTCR+CD3+) were co-cultured with autologous moDCs electroporated with mRNA encoding Mut or WT PIK3CA in the absence or presence of pan-HLA class I or class II blocking antibodies. ***P < 0.001, **P = 0.0036 and NS using two-sided Student’s t-test with Bonferroni correction. b,e,h, Symbols and bar graphs are displayed as mean ± s.e.m. d,f, Violin distributions are centered around the median (red horizontal line) with quartile ranges displayed above and below (dashed horizontal lines). The maxima and minima are represented by the top and bottom of each plot.

