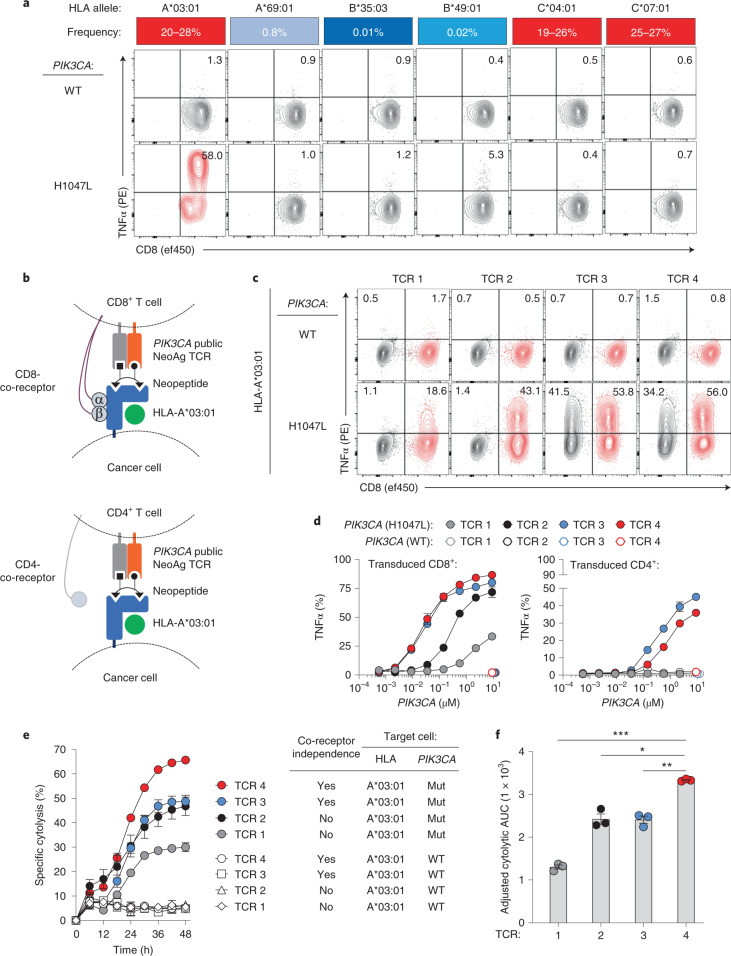
Fig. 2. HLA restriction and functional characterization of PIK3CA public NeoAg-specific TCRs.
a, Deconvolution of the HLA-I restriction element for the MSK 21LT2 clonotype 20 TCR. The frequency of individual HLA-I alleles expressed by HD1 in North American and European populations is displayed as a heat map. FACS plots show the frequency of CD8+ TCR-transduced T cells that secrete TNFα after co-culture with HLA-I mono-allelic cell lines expressing WT or Mut PIK3CA. b, Cartoon illustrating the experimental design to assess the co-receptor dependence and functionality of SIFT-seq-retrieved PIK3CA public NeoAg TCR panel members. TCRs 1–4 were individually RV transduced into enriched CD8+ or CD4+ T cells and co-cultured with target cells co-expressing HLA-A*03:01 and either WT or Mut PIK3CA. c, Representative FACS plots of CD4+ (black) and CD8+ (red) T cells expressing individual PIK3CA public NeoAg TCR panel members after co-culture with HLA-A*03:01+ target cells that express either WT or Mut PIK3CA. Numbers within each plot indicate the frequency of TNFα-producing TCR-transduced CD4+ (upper left quadrant) or CD8+ (upper right quadrant) T cells. The FACS plots shown in a and c are pre-gated on live+mTCR+ T cells. d, The functional avidity of CD8+ (left) or CD4+ (right) T cells individually transduced with TCRs 1–4. Transduced T cells were co-cultured with an HLA-I mono-allelic cell line expressing HLA-A*03:01 and electroporated with indicated concentrations of WT or Mut PIK3CA mRNA. e, Kinetic impedance-based lytic assay measuring the % specific cytolysis of HLA-A*03:01+ target cells expressing WT or Mut PIK3CA. f, Adjusted cytolytic AUC values indicating the cumulative cytolytic capacity of TCRs 1–4 against A*03:01+/Mut PIK3CA+ target cells. ***P = 0.001, **P = 0.01 and *P = 0.02; two-sided Student’s t-test was used for statistical analysis. Data shown in d, e and f are representative of two independent experiments using n = 3 biologically independent replicates per condition per independent experiment. Symbols and bar graphs are displayed as mean ± s.e.m. AUC, area under the curve.

