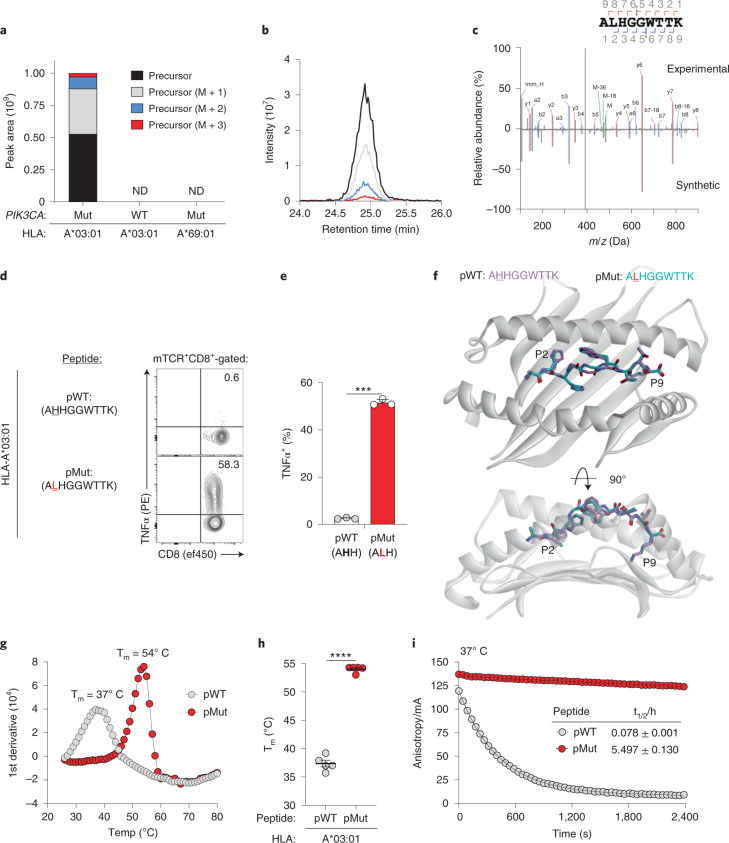
Fig. 3. Mechanism of immunogenicity for a PIK3CA public NeoAg.
a, Skyline analysis of HLA-I-bound peptides resulting from an LC–MS/MS-based immune-peptidomic screen. Relative abundance of precursor ions derived from peptides encompassing the PI3Kα protein’s 1047 position eluted from the indicated HLA-A mono-allelic cell lines. Cells expressed either WT PIK3CA or Mut PIK3CA (H1047L). ND indicates conditions in which no PI3Kα-derived AA sequences encompassing the 1047 hotspot position were experimentally detected. b, Corresponding chromatographic retention times of precursor ions derived from a Mut PI3Kα peptide eluted from HLA-A*03:01+/Mut PIK3CA+ cells. c, Mirror plot displaying the MS2 spectra of the Mut PI3Kα-derived public neoepitope (ALHGGWTTK; pMut; top) eluted from HLA-A*03:01+/Mut PIK3CA+ cells and a synthetically generated peptide (bottom). Peaks represent b ions in blue and y ions in red. Representative intracellular FACS analysis (d) and summary bar graph (e) for TNFα production in T cells transduced with TCR4 and co-cultured with HLA-A*03:01+ target cells pulsed with 1 μM of pMut versus pWT. Results shown after gating on live+mTCR+CD8+ lymphocytes. Bar graph is displayed as mean ± s.e.m. using n = 3 biologically independent replicates per condition. ***P = 0.001 using two-sided Student’s t-test. f, Structural superimposition of the pMut and pWT peptides bound to HLA-A*03:01. The conformations of pMut and pWT peptides are nearly identical with all α carbon atoms superimposing with a root mean square deviation of 0.73 Å. Representative thermal melt curves (g) and summary scatter plot (h) displaying the melting temperatures (Tm) of the pMut and pWT/HLA-A*03:01 complexes using differential scanning fluorimetry. Symbols are displayed as mean ± s.e.m. using n = 5 independently performed experiments. ****P < 0.0001 using two-sided Student’s t-test. i, Dissociation of a fluorescently labeled pMut or pWT from soluble HLA-A*03:01 complexes at 37 °C using fluorescence anisotropy. Solid lines show fits to exponential decay functions. Half-lives (t1/2) are shown for each peptide ± s.e.m. Data are representative of n = 3 technical replicates per condition per time point. mA, millianisotropy.

