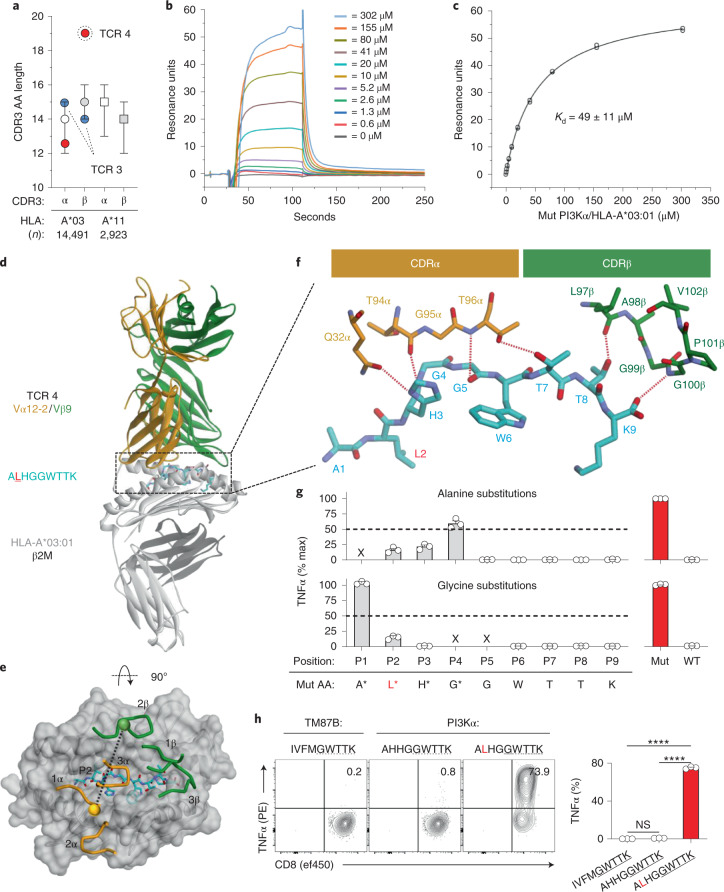
Fig. 4. Structural correlates of affinity and specificity for a PIK3CA public NeoAg-specific TCR.
a, CDR3α and CDR3β AA lengths of PIK3CA public NeoAg-specific TCR3, TCR4 and a panel of n = 17,414 HLA-A*03:01-restricted and HLA-A*11:01-restricted TCR sequences. Results shown as median ± interquartile range. Representative SPR sensorgram (b) and steady-state binding equilibrium (c) measuring the dissociation constant (Kd) for TCR4 to the pMut/HLA-I complex. Results shown are the average ± s.d. of n = 4 independent experiments. d, Structural overview of the TCR4 pMut/HLA-A*03:01 ternary complex at 3.1-Å resolution. The color scheme is indicated and replicated throughout. e, Top view of the pMut/HLA-A*03:01 complex displaying the crossing angle and positions of the six CDR loops of TCR4. Spheres represent the centers of mass of the TCR’s Vα and Vβ domains. f, AAs of TCR4’s CDRα and CDRβ loops that interact with the pMut peptide. Hydrogen bonds (n = 6) are indicated by red dashed lines. AAs are identified by standard one-letter codes followed by position number. The side chains of contacting residues from the TCR are also identified by AA and hemi-chain position number. g, Identification of TCR4’s peptide recognition motif using alanine and glycine scanning. Intracellular FACS for TNFα production to Ala (upper) or Gly (lower) substituted peptides. TCR4-transduced T cells (identified by gating on mTCR+ lymphocytes) were co-cultured with HLA-A*03:01+ targets pulsed with 1 μM of indicated peptides. Results are shown as the mean ± s.e.m. percent maximum response relative to the native pMut peptide using n = 3 biologic replicates per condition. ‘x’ indicates positions not amenable to substitution. h, Measurement of the cross-reactivity potential of TCR4. TCR4-transduced T cells were co-cultured with HLA-A*03:01+ targets pulsed with 1 μM of peptides containing the motif ‘x-x-x-x-G-W-T-T-K’. Results are shown as mean ± s.e.m. using n = 3 biologic replicates per condition. ****P < 0.0001 using two-sided Student’s t-test with Bonferroni correction. NS, not significant.

