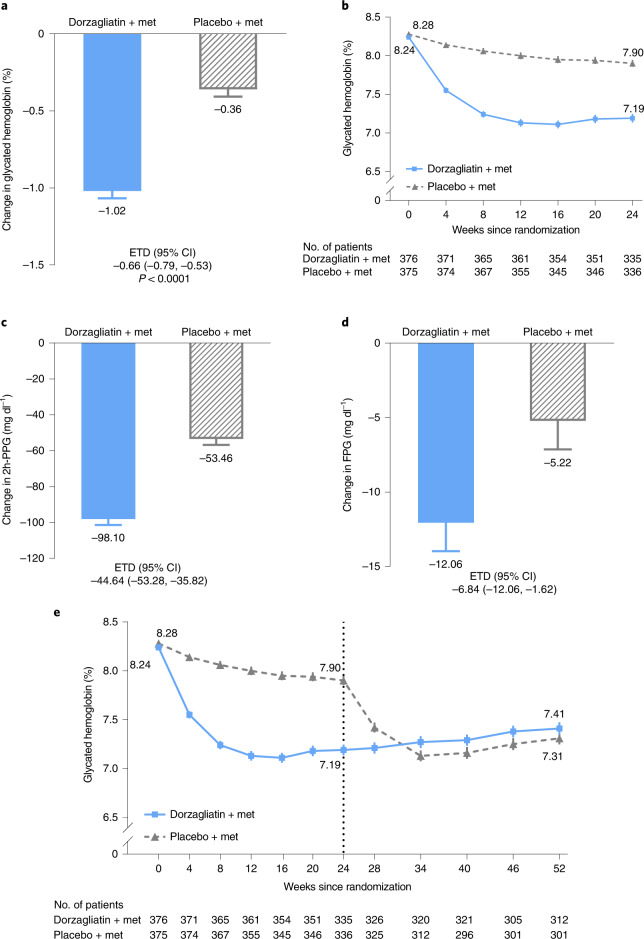
Fig. 2. Primary and secondary efficacy endpoints.
a, The primary endpoint: LS mean changes in the HbA1c level from baseline to week 24 in patients who received either dorzagliatin and metformin or placebo and metformin. The ETD and corresponding 95% CI were estimated using, in the FAS, an MMRM without missing value imputation (dorzagliatin, n = 374; placebo, n = 374) (P < 0.0001). b, The mean HbA1c level recorded at each visit over 24 weeks in patients who received either dorzagliatin and metformin or placebo and metformin. c, The LS mean change in 2h-PPG levels from baseline. ETD and 95% CI were estimated in the FAS using an MMRM (dorzagliatin, n = 360; placebo, n = 355). d, The LS mean change in FPG from baseline. ETD and 95% CI were estimated in the FAS using an MMRM (dorzagliatin, n = 374; placebo, n = 374). e, The mean HbA1c levels measured at each visit over 52 weeks. The FAS comprised all randomized patients who took at least one dose of the study drug and had at least one post-treatment measurement of the primary endpoint during the double-blind treatment period. All statistical tests were two-sided at a significance level of 0.05, and no adjustments were made for multiplicity. Data in a, c and d are presented as LS mean ± s.e.; data in b and e are presented as mean ± s.e. Met: metformin.

